

Pan-Cancer Analysis of Human Kinome Gene Expression and Promoter DNA Methylation Identifies Dark Kinase Biomarkers in Multiple Cancers
- PMID: 33801837
- PMCID: PMC8001681
- DOI: 10.3390/cancers13061189
Pan-Cancer Analysis of Human Kinome Gene Expression and Promoter DNA Methylation Identifies Dark Kinase Biomarkers in Multiple Cancers
Abstract
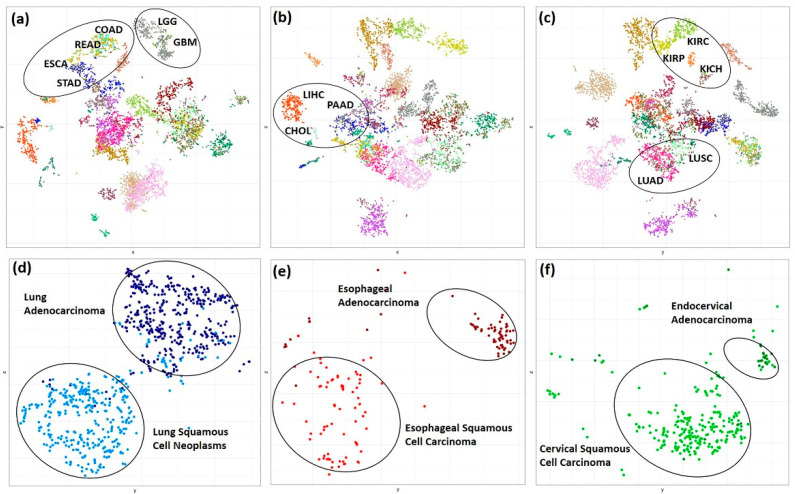
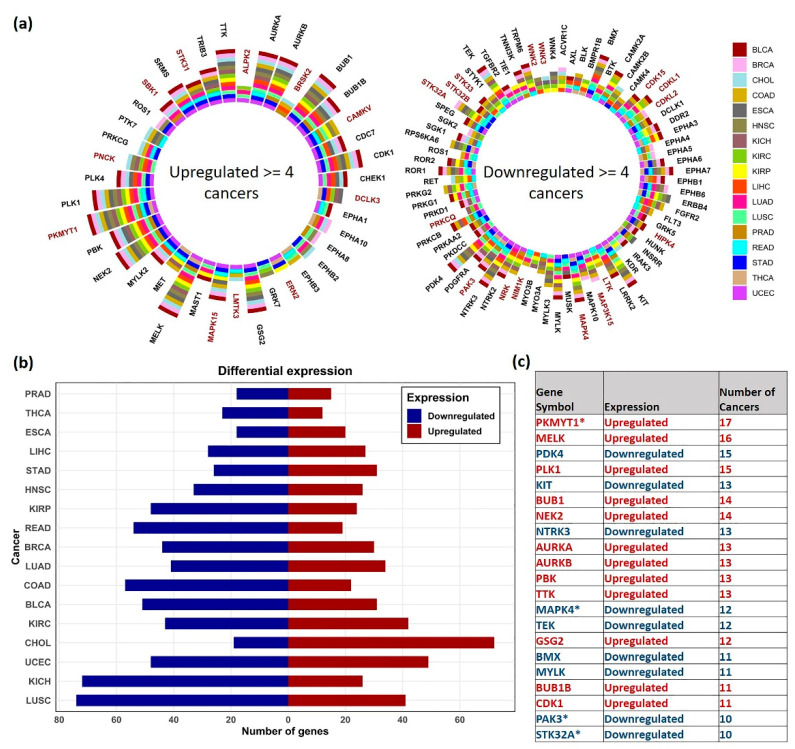
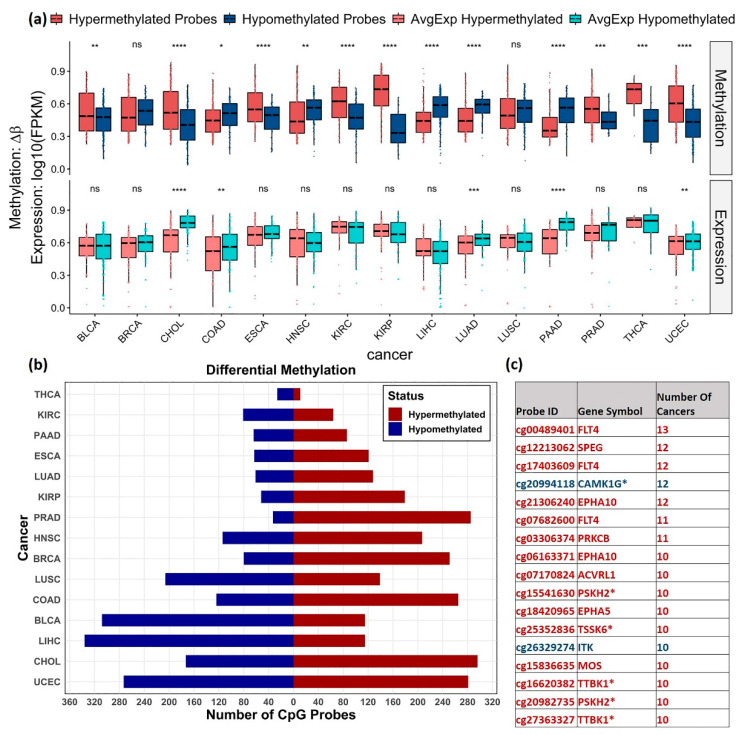
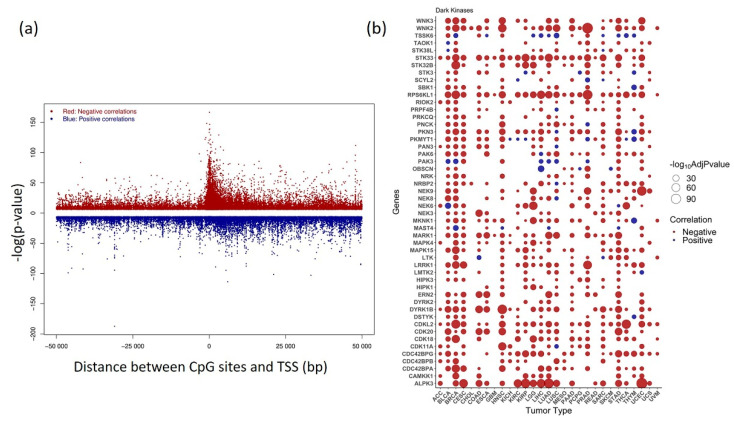
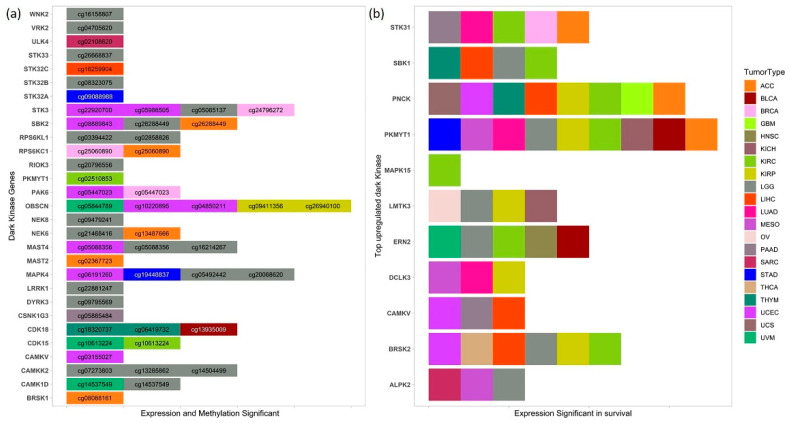
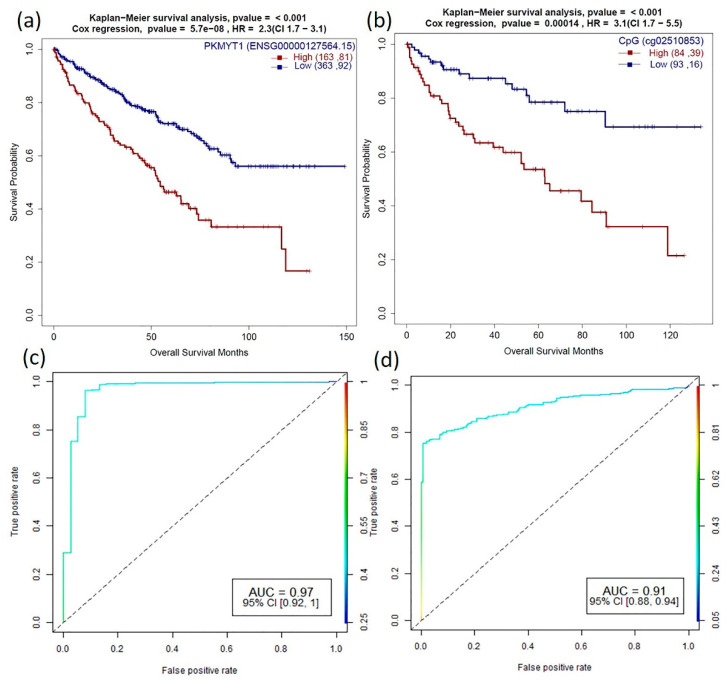
Kinases are a group of intracellular signaling molecules that play critical roles in various biological processes. Even though kinases comprise one of the most well-known therapeutic targets, many have been understudied and therefore warrant further investigation. DNA methylation is one of the key epigenetic regulators that modulate gene expression. In this study, the human kinome's DNA methylation and gene expression patterns were analyzed using the level-3 TCGA data for 32 cancers. Unsupervised clustering based on kinome data revealed the grouping of cancers based on their organ level and tissue type. We further observed significant differences in overall kinase methylation levels (hyper- and hypomethylation) between the tumor and adjacent normal samples from the same tissue. Methylation expression quantitative trait loci (meQTL) analysis using kinase gene expression with the corresponding methylated probes revealed a highly significant and mostly negative association (~92%) within 1.5 kb from the transcription start site (TSS). Several understudied (dark) kinases (PKMYT1, PNCK, BRSK2, ERN2, STK31, STK32A, and MAPK4) were also identified with a significant role in patient survival. This study leverages results from multi-omics data to identify potential kinase markers of prognostic and diagnostic importance and further our understanding of kinases in cancer.
Keywords: CpG methylation; TCGA; correlation analysis; dark kinase; kinome; pan-cancer; promoter; survival analysis; understudied kinase.
Conflict of interest statement
The authors declare no conflict of interest. The funders had no role in the design of the study; in the collection, analyses, or interpretation of data; in the writing of the manuscript, or in the decision to publish the results.
Figures
Similar articles
-
Genome-wide DNA methylation analysis reveals molecular subtypes of pancreatic cancer.Oncotarget. 2017 Apr 25;8(17):28990-29012. doi: 10.18632/oncotarget.15993. Oncotarget. 2017. PMID: 28423671 Free PMC article.
-
Serine/threonine kinases 31(STK31) may be a novel cellular target gene for the HPV16 oncogene E7 with potential as a DNA hypomethylation biomarker in cervical cancer.Virol J. 2016 Apr 5;13:60. doi: 10.1186/s12985-016-0515-5. Virol J. 2016. PMID: 27044426 Free PMC article.
-
Correlation Patterns Between DNA Methylation and Gene Expression in The Cancer Genome Atlas.Cancer Inform. 2019 Feb 11;18:1176935119828776. doi: 10.1177/1176935119828776. eCollection 2019. Cancer Inform. 2019. PMID: 30792573 Free PMC article.
-
Gene methylation in gastric cancer.Clin Chim Acta. 2013 Sep 23;424:53-65. doi: 10.1016/j.cca.2013.05.002. Epub 2013 May 10. Clin Chim Acta. 2013. PMID: 23669186 Review.
-
Illuminating function of the understudied druggable kinome.Drug Discov Today. 2024 Mar;29(3):103881. doi: 10.1016/j.drudis.2024.103881. Epub 2024 Jan 11. Drug Discov Today. 2024. PMID: 38218213 Free PMC article. Review.
Cited by
-
Enzalutamide-induced signatures revealed by epigenetic plasticity using single-cell multi-omics sequencing in prostate cancer.Mol Ther Nucleic Acids. 2023 Feb 18;31:648-661. doi: 10.1016/j.omtn.2023.02.022. eCollection 2023 Mar 14. Mol Ther Nucleic Acids. 2023. PMID: 36910711 Free PMC article.
-
Identification of biological pathways and processes regulated by NEK5 in breast epithelial cells via an integrated proteomic approach.Cell Commun Signal. 2022 Dec 22;20(1):197. doi: 10.1186/s12964-022-01006-y. Cell Commun Signal. 2022. PMID: 36550548 Free PMC article.
-
Cellular and molecular effects of PNCK, a non-canonical kinase target in renal cell carcinoma.iScience. 2022 Nov 17;25(12):105621. doi: 10.1016/j.isci.2022.105621. eCollection 2022 Dec 22. iScience. 2022. PMID: 36465101 Free PMC article.
-
Integration of CRISPR/dCas9-Based methylation editing with guide positioning sequencing identifies dynamic changes of mrDEGs in breast cancer progression.Cell Mol Life Sci. 2025 Jan 21;82(1):46. doi: 10.1007/s00018-024-05562-z. Cell Mol Life Sci. 2025. PMID: 39833630 Free PMC article.
-
Illuminating the druggable genome: Pathways to progress.Drug Discov Today. 2024 Mar;29(3):103805. doi: 10.1016/j.drudis.2023.103805. Epub 2023 Oct 27. Drug Discov Today. 2024. PMID: 37890715 Free PMC article. Review.
References
-
- Yang R.Y., Quan J., Sodaei R., Aguet F., Segrè A.V., Allen J.A., Lanz T.A., Reinhart V., Crawford M., Hasson S., et al. A systematic survey of human tissue-specific gene expression and splicing reveals new opportunities for therapeutic target identification and evaluation. bioRxiv. 2018 doi: 10.1101/311563. - DOI
Grants and funding
LinkOut - more resources
Full Text Sources
Other Literature Sources
Miscellaneous
