. 2021 Mar 10;10(3):610.
doi: 10.3390/cells10030610.

Resistance of Hypoxic Cells to Ionizing Radiation Is Mediated in Part via Hypoxia-Induced Quiescence

Affiliations

Resistance of Hypoxic Cells to Ionizing Radiation Is Mediated in Part via Hypoxia-Induced Quiescence

Apostolos Menegakis et al. Cells. .

Abstract

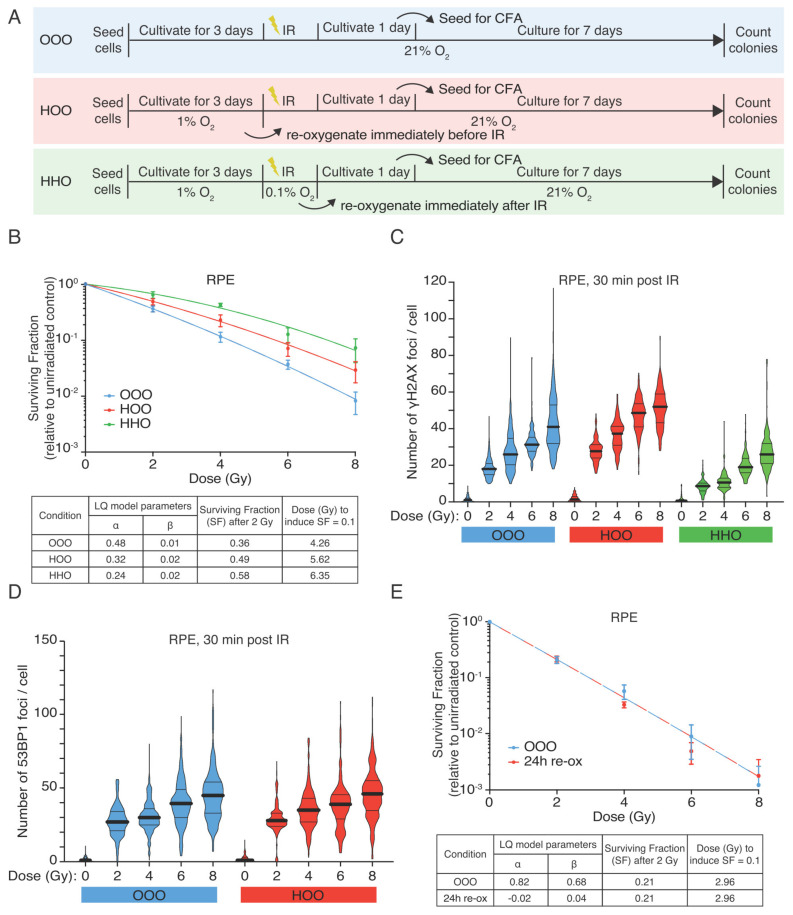
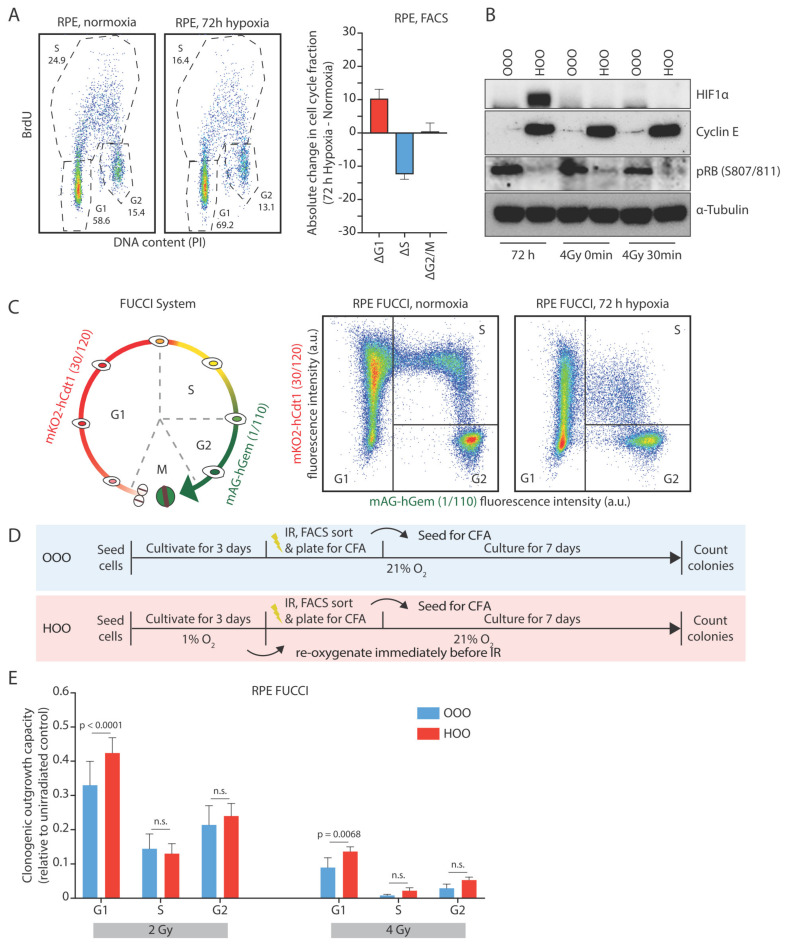
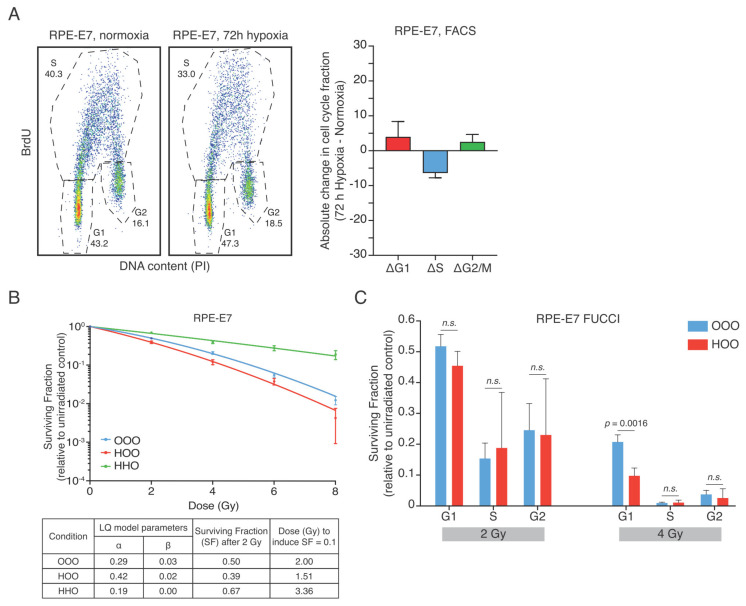
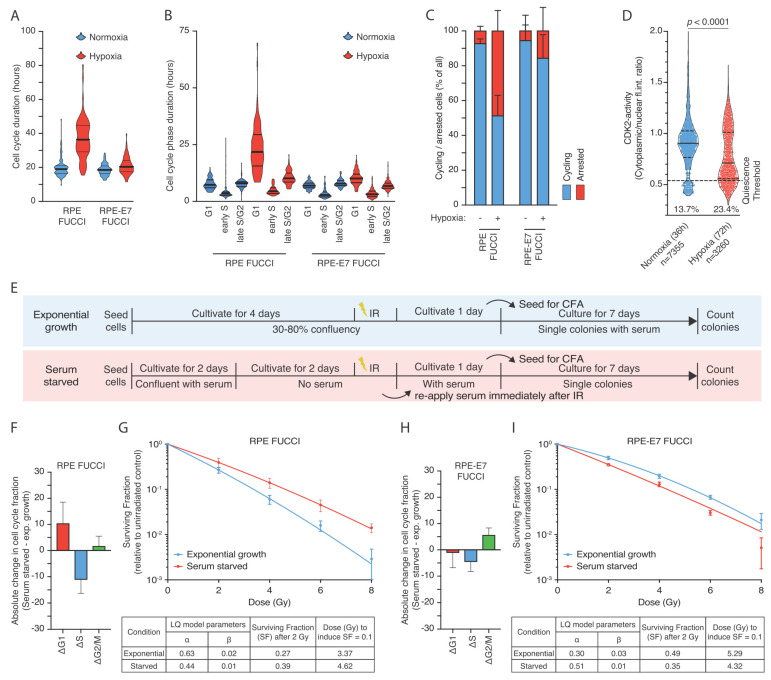
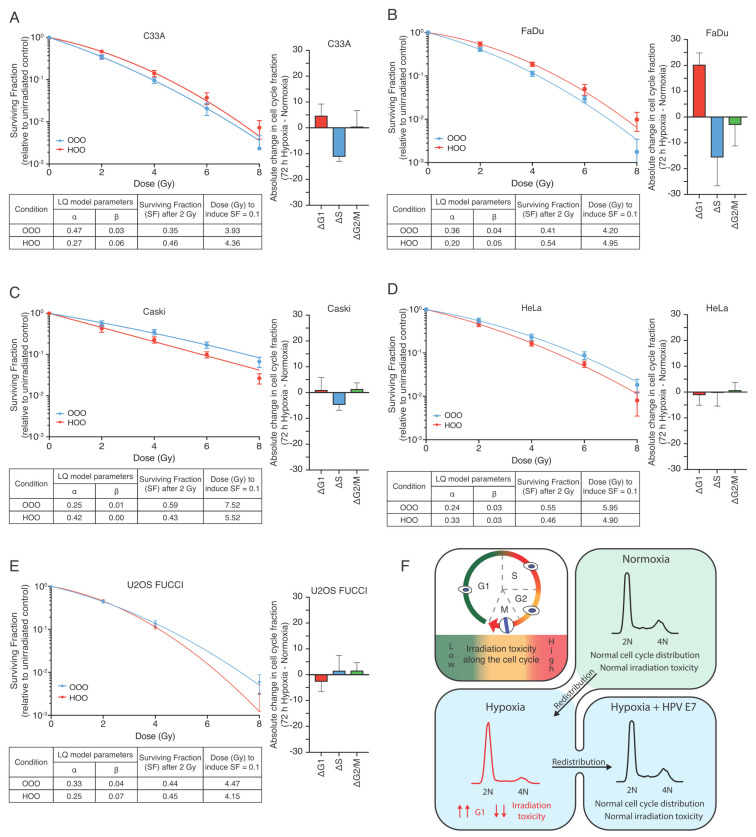
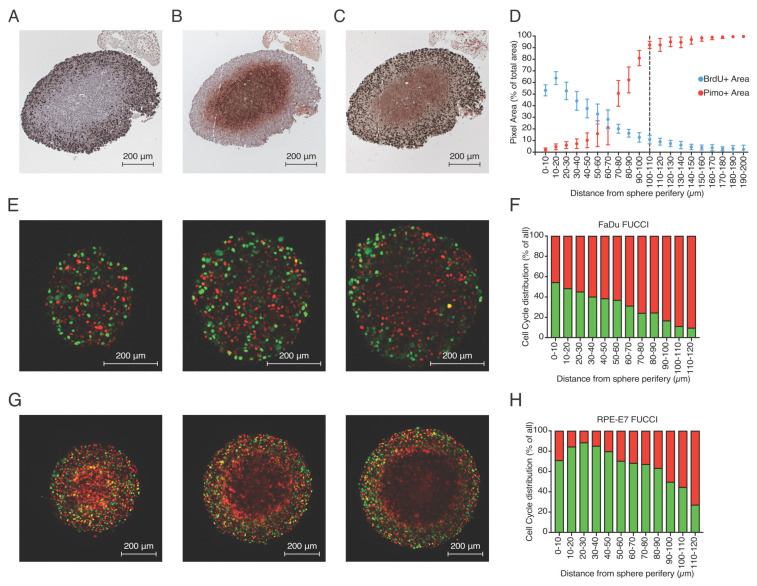
Double strand breaks (DSBs) are highly toxic to a cell, a property that is exploited in radiation therapy. A critical component for the damage induction is cellular oxygen, making hypoxic tumor areas refractory to the efficacy of radiation treatment. During a fractionated radiation regimen, these hypoxic areas can be re-oxygenated. Nonetheless, hypoxia still constitutes a negative prognostic factor for the patient's outcome. We hypothesized that this might be attributed to specific hypoxia-induced cellular traits that are maintained upon reoxygenation. Here, we show that reoxygenation of hypoxic non-transformed RPE-1 cells fully restored induction of DSBs but the cells remain radioresistant as a consequence of hypoxia-induced quiescence. With the use of the cell cycle indicators (FUCCI), cell cycle-specific radiation sensitivity, the cell cycle phase duration with live cell imaging, and single cell tracing were assessed. We observed that RPE-1 cells experience a longer G1 phase under hypoxia and retain a large fraction of cells that are non-cycling. Expression of HPV oncoprotein E7 prevents hypoxia-induced quiescence and abolishes the radioprotective effect. In line with this, HPV-negative cancer cell lines retain radioresistance, while HPV-positive cancer cell lines are radiosensitized upon reoxygenation. Quiescence induction in hypoxia and its HPV-driven prevention was observed in 3D multicellular spheroids. Collectively, we identify a new hypoxia-dependent radioprotective phenotype due to hypoxia-induced quiescence that accounts for a global decrease in radiosensitivity that can be retained upon reoxygenation and is absent in cells expressing oncoprotein E7.

Keywords: G1-arrest; HPV; hypoxia; quiescence; radiation resistance.


Conflict of interest statement

The authors declare no conflict of interest.

Figures

Figure 1
Figure 1
Hypoxic RPE cells retain radioresistant phenotype upon reoxygenation. (A) Graphical representation of the experimental design (B) Colony-forming assay of RPEcells. RPEcells were irradiated with graded single doses of irradiation after being constantly under normoxic conditions (blue curve—OOO), for 72 h in hypoxia (1% O2) and subsequently irradiated in aerated condition (time of reoxygenation in the range of 15 min) (red curve—HOO) and after 72 h hypoxia and irradiation under hypoxic conditions (0.1% O2—green curve HHO) before been reoxygenated immediately after IR. The data points represent the means of three independent experiments, and the error bars the 95% C.I. of the means estimation. The data were fitted with linear quadratic model, the parameters of the Linear Quadratic model (LQ) of the RPE survival curves are shown collectively for all conditions in a separate table. (C) DNA DSBs measured as γH2AX foci in RPEcells 30 min after irradiation with graded single doses of irradiation under normoxic (OOO, blue violin plots) and hypoxic conditions either kept in 1% O2 for 72 h and reoxygenated just prior to irradiation (HOO, red violin plots) or also irradiated under hypoxia (0.01% O2) (HHO, green violin plots). (D) 53BP1 foci in RPE cells 30 min post-irradiation (two of the conditions as referred in (B). Black solid lines represent the population mean and the dotted lines the quartiles of the data distribution (E) Colony-forming assay of RPE-1 cells that have been kept under hypoxic conditions (1% O2) for 72 h, before being reoxygenated for 24 h and then irradiated under normoxic conditions. Data represent the pool of three independent experiments, and the error bars the 95% C.I. of the means estimation. The parameters of the LQ model are depicted in a separated table.
Figure 2
Figure 2
The hypoxia-induced G1-arrest causes continued radioresistance after reoxygenation. (A) Typical cell cycle distribution of RPE cells grown for 72 h in normoxic or hypoxic conditions (1% O2). The difference of each cell cycle phase fraction between hypoxic and normoxic cell cycle distribution (Δcell cycle population fraction) is depicted. (B) Western blot analysis of cells that have been cultured in normoxia (OO) or hypoxia (HO) before being irradiated in aerated conditions. Western blot samples were collected after culturing cells for 72 h in normoxia and hypoxia, at the time of irradiation in aerated conditions and 30 min post-IR. HIF1a as a marker of active hypoxic signaling, Cyclin E1 as a marker of quiescence, and pRB (807/811) as a marker of active transition from G1 to S phase are shown (C) Graphical representation of the FUCCI system. Typical cell density plots acquired from mock-irradiated RPE FUCCI cultivated either under normoxic or hypoxic conditions. The cell cycle profile based on the expression of the red and green fluorescence and the sorting of the populations is depicted (see material and methods text for more details). (D) Graphical representation of the experimental design. (E) The Surviving fraction of different cell subpopulations (indicated in B) after 2 and 4 Gy is shown. The bars represent the mean differences of three independent experiments, and the error bars the 95% C.I. of the means.
Figure 3
Figure 3
Human papilloma protein E7 prevents the hypoxia-induced G1-arrest and reverses radioresistance after reoxygenation. (A) Typical cell cycle distribution of RPE-E7 cells grown for 72 h in normoxic or hypoxic conditions (1% O2). The difference of each cell cycle phase fraction between hypoxic and normoxic cell cycle distribution (Δcell cycle population fraction) is depicted. (B) Colony-forming assay of RPE-E7 cells. RPE-E7 cells were irradiated with graded single doses of irradiation after being constantly under normoxic conditions (blue curve—OOO) for 72 h in hypoxia (1% O2) and subsequently irradiated in aerated condition (red curve—HOO) and after 72 h hypoxia and irradiation under hypoxic condition (green curve—HHO). The data were fitted with linear quadratic model, the parameters of the Linear Quadratic model (LQ) of the survival curves are shown collectively for all conditions in a separate table. (Experimental design as in Figure 1A). (C) Surviving fraction of different cell cycle phase subpopulations after 2 and 4 Gy is shown. The data represent the mean of three independent experiments, and the error bars the 95% C.I. of the mean. The experimental plan is similar to Figure 2D.
Figure 4
Figure 4
Hypoxia-induced quiescence determines radioresistance upon reoxygenation. (AB) Total cell cycling time and the duration of RPE FUCCI and RPE-E7 FUCCI cells residing in each cell cycle phase and as analyzed based on live cell tracing throughout the cell cycle. (C) Analysis of cell cycle behavior in RPE FUCCI and RPE-E7 FUCCI cells in terms of cell cycle progression based on live cell tracing throughout the cell cycle. (D) Analysis of live cell CDK2-activity reporter. Representative distribution of cytoplasmic to nuclear intensity ratio for normoxic and hypoxic cells at similar cell densities. The horizontal line indicates the threshold levels (0.55 ratio) previously reported in cells that undergo mitogen-starvation induced quiescence [40]. The numbers indicate the total number of cells analyzed per condition and the fraction of cells with lower than 0.55 ratio. (E) graphical representation of the serum starvation experiments (FI) Differences of each cell cycle phase fractions of exponentially growing and serum starved RPE FUCCI (F) and RPE-E7 FUCCI (H) cells. The difference of each cell cycle phase fraction between hypoxic and normoxic cell cycle distribution (Δcell cycle population fraction) is depicted for RPE-FUCCI (F) and RPE-E7 FUCCI (H), respectively. Colony-forming assay of RPE FUCCI (G) and RPE-E7 FUCCI (I) cells irradiated with graded single doses of irradiation after being either re-plated and growing exponentially or reaching confluency and serum starvation for 48 h at the time of irradiation.
Figure 5
Figure 5
Hypoxia-induced G1-arrest determines radioresistance upon reoxygenation in tumor cell lines and it is governed by the HPV status: (AB) Difference of each cell cycle phase fraction between hypoxic and normoxic cell cycle distribution (Δcell cycle population fraction) along with colony-forming assay of HPV-negative C33A (A) and FaDu (B). Cells were irradiated with graded single doses of irradiation after being either constantly under normoxic conditions (blue curve—OOO) or for 72 h in hypoxia (1% O2) and subsequently irradiated in aerated condition (red curve—HOO). (CD) Difference of each cell cycle phase fraction between hypoxic and normoxic cell cycle distribution (Δcell cycle population fraction) along with colony-forming assay of HPV-positive Caski (C) and Hela (D) cells Similar conditions as in (AB). (E) Difference of each cell cycle phase fraction between hypoxic and normoxic cell cycle distribution (Δcell cycle population fraction) along with colony-forming assay of HPV-negative U2OS cells that exhibit an aberrant G1/S transition. Cells were irradiated after being either constantly under normoxic conditions (blue curve—OOO), for 72 h in hypoxia (1% O2) and subsequently irradiated in aerated condition (red curve—HOO) or for 72 h in hypoxia (1% O2)and also irradiated under hypoxic conditions (green curve—HHO). The parameters of the Linear Quadratic model (LQ) of the survival curves are shown collectively for all conditions in separate tables. (F) Graphical representation of our working model depicting the main findings of the study.
Figure 6
Figure 6
Proliferation and hypoxia profile in multicellular spheroids. (AC) Characteristic staining of three consecutive central cross-sections (3 μm distance between them) of FaDu spheroids stained for BrdU-positive cells (A), pimonidazole-positive area (B) and double staining (C). (D) Quantification of BrdU and pimonidazole signal over different distances from the outer rim of the multiple spheroids on central cross-sections of FaDu shperoids where the anti-correlation of the two parameters is depicted. (E) 2-photon microsopy image of FaDu-FUCCI spheroid cross-sections at different z-levels are depicted (extracted from Supplementary Video S1). (F) 3-D quantification of fraction of FUCCI- expressing cells location in relation to the outer rim in FaDu-FUCCI multicellular spheroids. (G) 2-photon microsopy image of RPE-E7-FUCCI spheroid cross-sections at different z-levels are depicted (extracted from Supplementary Video S2). (G) 3-D quantification of the percentage of FUCCI-expressing cells from the outer rim in FaDu FUCCI multicellular spheroids. (H) 3-D quantification of the percentage of FUCCI-expressing cells from the outer rim in RPE-E7 FUCCI multicellular spheroids.

Similar articles

Cited by

References

    1. Harris A.L. Hypoxia—A key regulatory factor in tumour growth. Nat. Rev. Cancer. 2002;2:38–47. doi: 10.1038/nrc704. - DOI - PubMed
    1. Wilson W.R., Hay M.P. Targeting hypoxia in cancer therapy. Nat. Rev. Cancer. 2011;11:393–410. doi: 10.1038/nrc3064. - DOI - PubMed
    1. Lalonde E., Ishkanian A.S., Sykes J., Fraser M., Ross-Adams H., Erho N., Dunning M.J., Halim S., Lamb A.D., Moon N.C., et al. Tumour genomic and microenvironmental heterogeneity for integrated prediction of 5-year biochemical recurrence of prostate cancer: A retrospective cohort study. Lancet Oncol. 2014;15:1521–1532. doi: 10.1016/S1470-2045(14)71021-6. - DOI - PubMed
    1. Linge A., Lohaus F., Löck S., Nowak A., Gudziol V., Valentini C., Von Neubeck C., Jütz M., Tinhofer I., Budach V., et al. HPV status, cancer stem cell marker expression, hypoxia gene signatures and tumour volume identify good prognosis subgroups in patients with HNSCC after primary radiochemotherapy: A multicentre retrospective study of the German Cancer Consortium Radiation Oncology Group (DKTK-ROG) Radiother. Oncol. 2016;121:364–373. doi: 10.1016/j.radonc.2016.11.008. - DOI - PubMed
    1. Nordsmark M., Overgaard J. Tumor hypoxia is independent of hemoglobin and prognostic for loco-regional tumor control after primary radiotherapy in advanced head and neck cancer. Acta Oncol. 2004;43:396–403. doi: 10.1080/02841860410026189. - DOI - PubMed

Publication types

LinkOut - more resources