. 2021 Mar 10;11(3):764.
doi: 10.3390/ani11030764.

The Impact of Polyamine Precursors, Polyamines, and Steroid Hormones on Temporal Messenger RNA Abundance in Bovine Satellite Cells Induced to Differentiate

Affiliations

The Impact of Polyamine Precursors, Polyamines, and Steroid Hormones on Temporal Messenger RNA Abundance in Bovine Satellite Cells Induced to Differentiate

Caleb C Reichhardt et al. Animals (Basel). .

Abstract

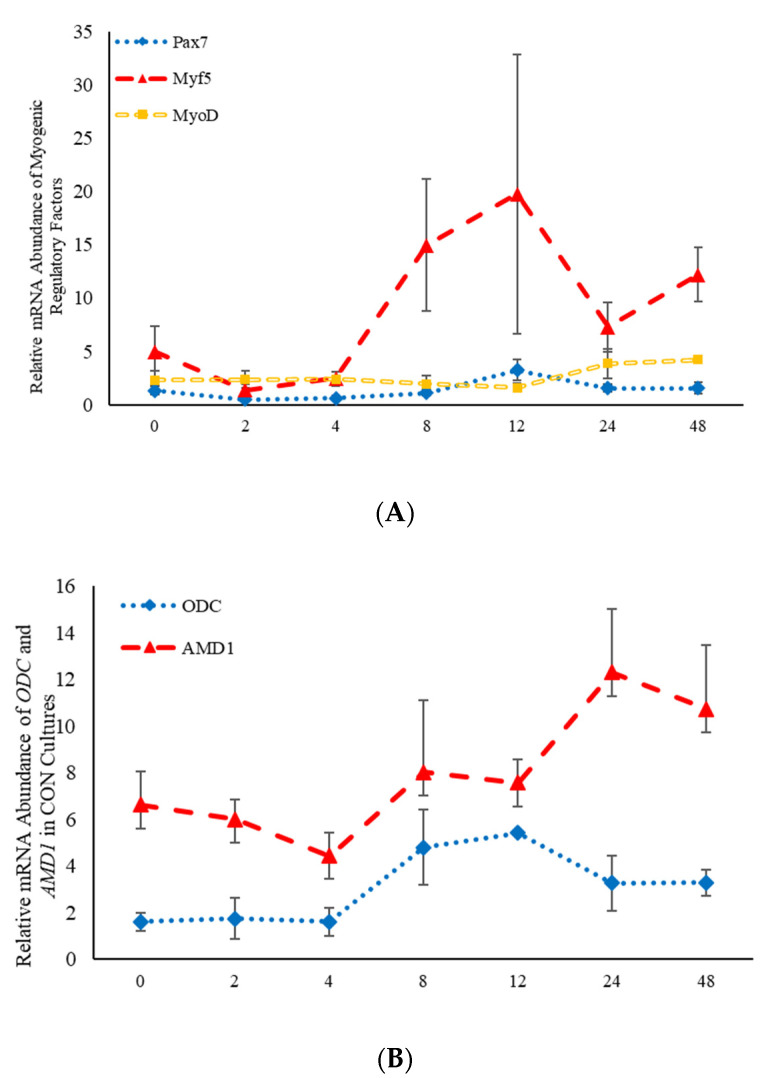
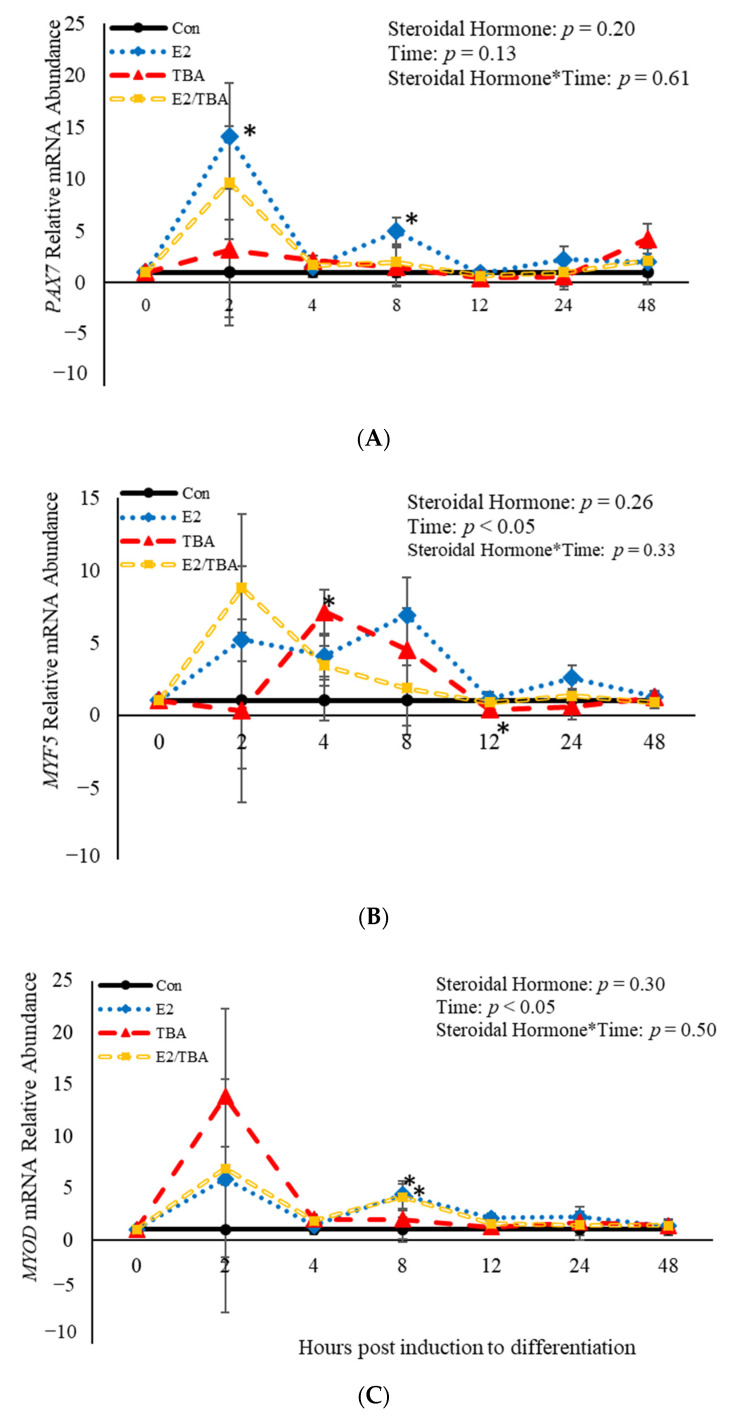
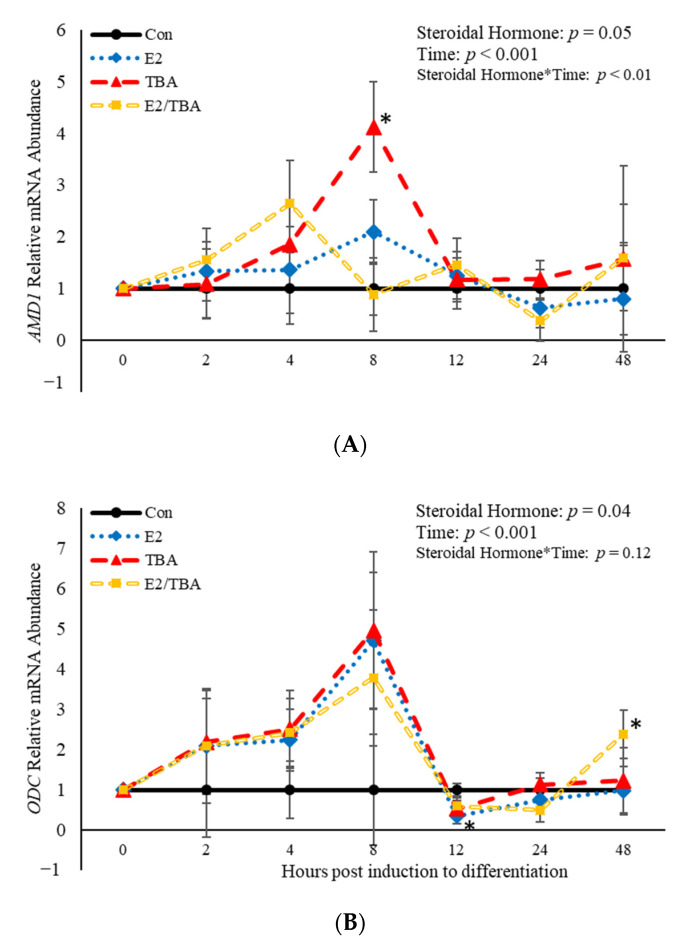
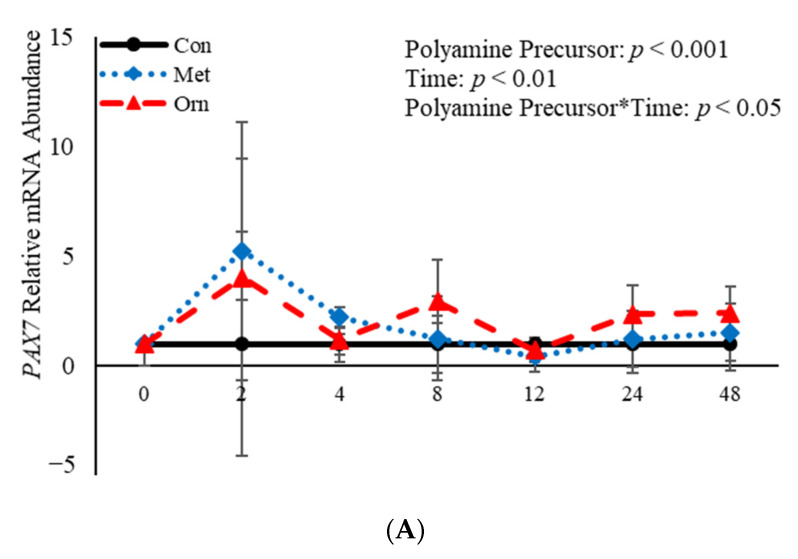
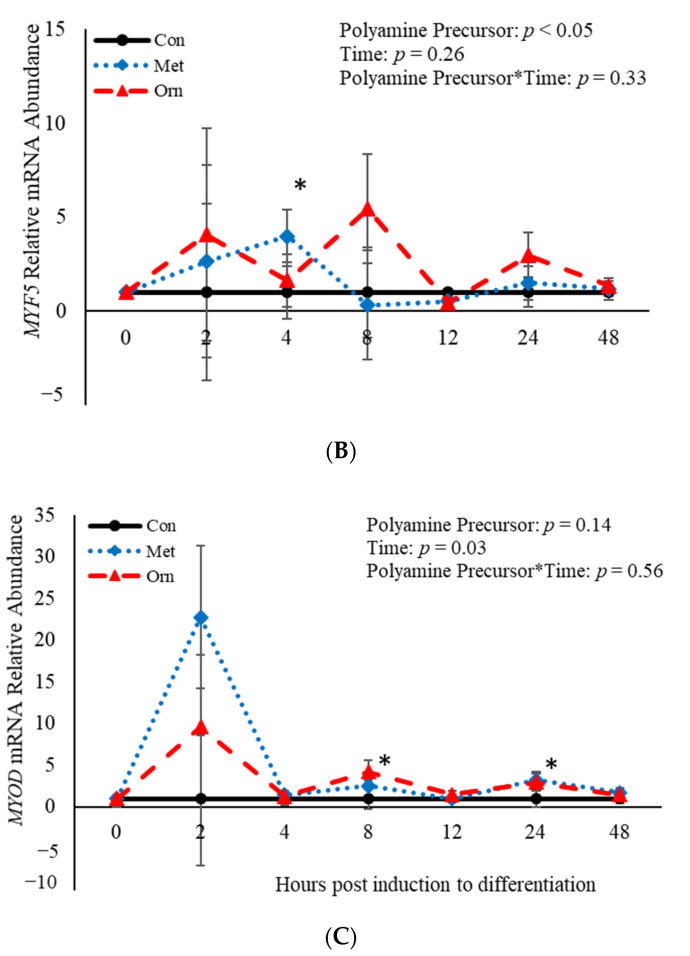
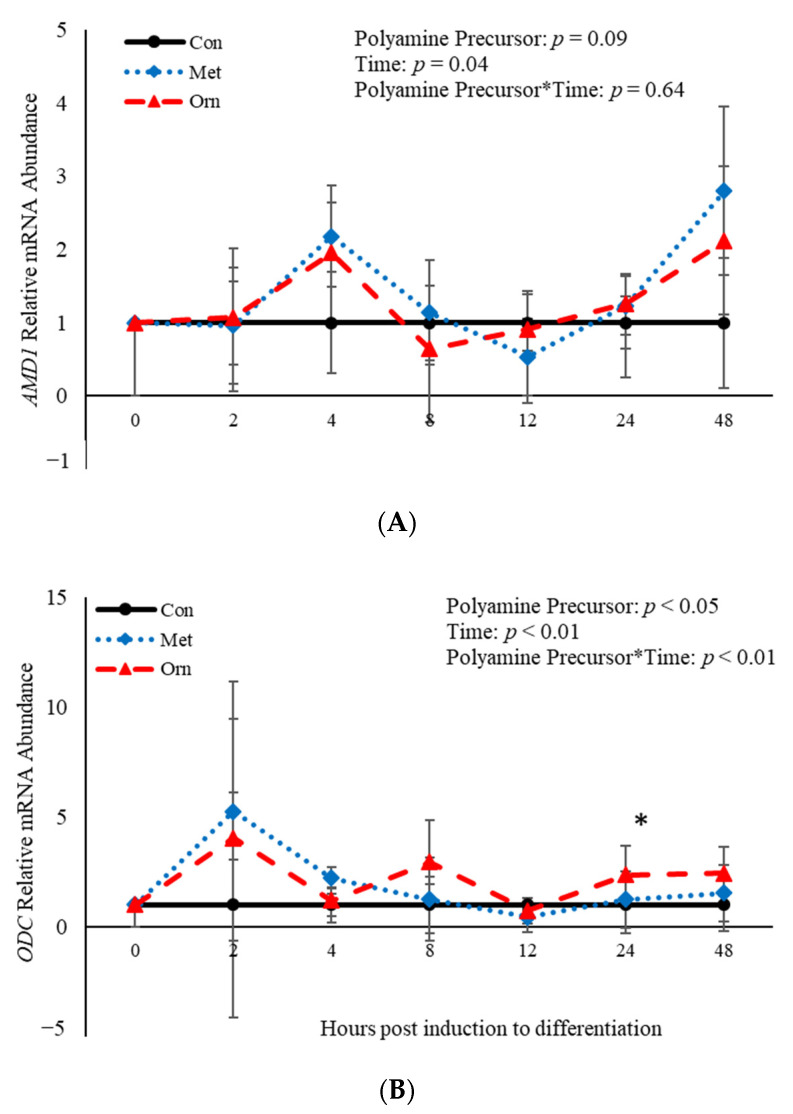
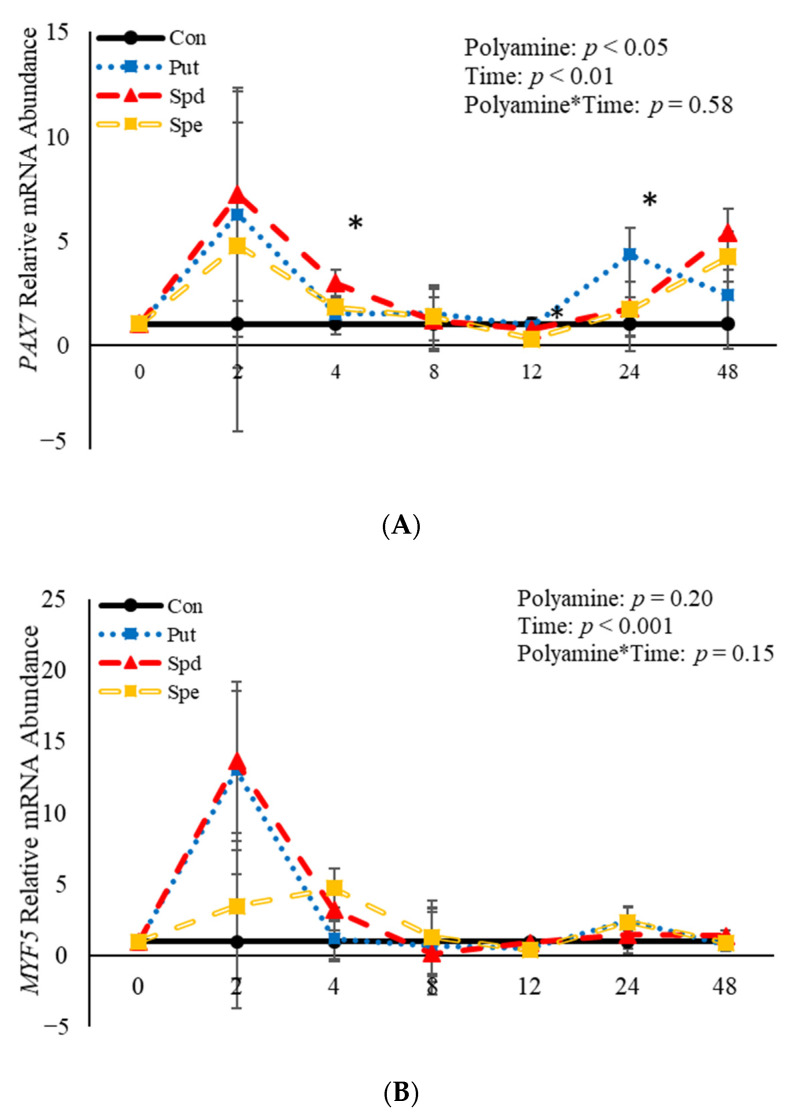
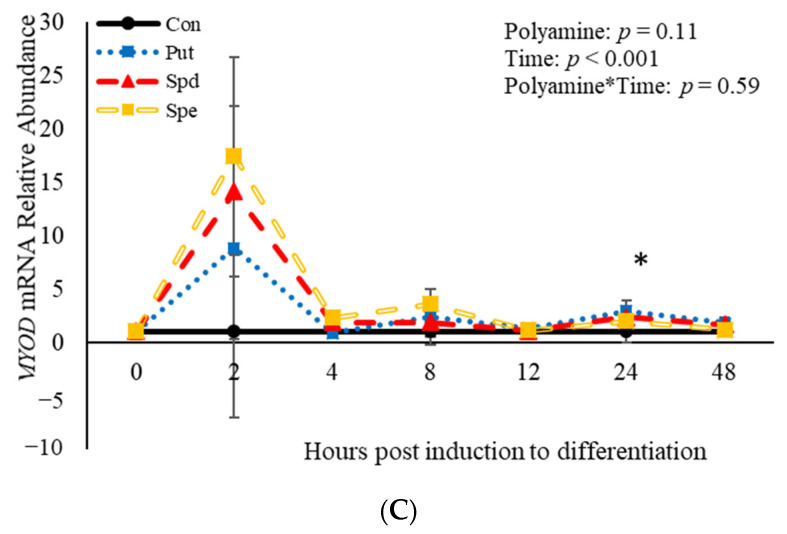
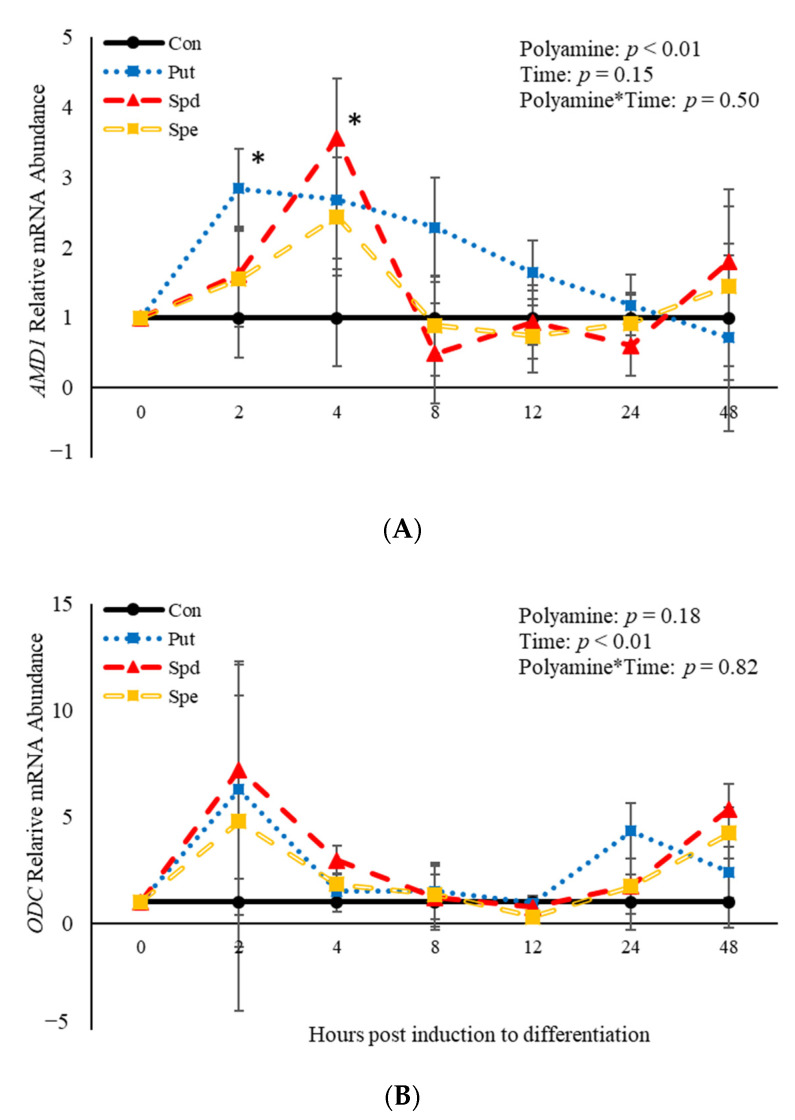
Emerging research suggests that hormones found in anabolic implants interact with polyamine biosynthesis. The objective of this study was to determine the effects of steroidal hormones, polyamines and polyamine precursors on bovine satellite cell (BSC) differentiation and polyamine biosynthesis temporally. Primary BSCs were induced to differentiate in 3% horse serum (CON) and treated with 10 nM trenbolone acetate (TBA), 10 nM estradiol (E2), 10 nM TBA and 10 nM E2, 10 mM methionine, 8 mM ornithine, 2 mM putrescine, 1.5 mM spermidine, or 0.5 mM spermine. Total mRNA was isolated 0, 2, 4, 8, 12, 24, and 48 h post-treatment. Abundance of mRNA for genes associated with induction of BSC differentiation: paired box transcription factor 7, myogenic factor 5, and myogenic differentiation factor 1 and genes in the polyamine biosynthesis pathway: ornithine decarboxylase and S-adenosylmethionine-were analyzed. Overall, steroidal hormones did not impact (p > 0.05) mRNA abundance of genes involved in BSC differentiation, but did alter (p = 0.04) abundance of genes involved in polyamine biosynthesis. Polyamine precursors influenced (p < 0.05) mRNA of genes involved in BSC differentiation. These results indicate that polyamine precursors and polyamines impact BSC differentiation and abundance of mRNA involved in polyamine biosynthesis, while steroidal hormones altered the mRNA involved in polyamine biosynthesis.

Keywords: anabolic implants; beef; bovine satellite cells; polyamines; skeletal muscle.


Conflict of interest statement

The authors declare no conflict of interest.

Figures

Figure 1
Figure 1
Relative mRNA abundance of the myogenic regulatory factors (A): paired box transcription factor 7 (Pax7), myogenic factor 5 (Myf5), and myogenic differentiation factor 1 (MyoD) and relative mRNA abundance of the two rate limiting steps involved in the polyamine biosynthesis pathway (B): S-adenosylmethionine decarboxylase (AMD1) and ornithine decarboxylase (ODC) from control-treated primary bovine satellite cells cultures over time. Abundance was measured 0, 2, 4, 8, 12, 24 and 48 h after treatment, as described in the Materials and Methods.
Figure 2
Figure 2
Relative mRNA abundance of paired box transcription factor 7 (PAX7; (A), myogenic factor 5 (MYF5; (B), and myogenic differentiation factor 1 (MYOD; (C) from primary bovine satellite cells cultures following treatment with 10 nM trenbolone acetate (TBA), 10 nM estradiol (E2), or 10 nM E2 and 10 nM TBA (E2/TBA). Cultures were grown to 80% confluency and treated with DMEM/3% horse serum and 10 nM TBA, 10 nM E2, or 10 nM E2/TBA. Abundance was measured 0, 2, 4, 8, 12, 24 and 48 h after treatment, as described in the Materials and Methods. The main effects of steroidal hormone, time and steroidal hormone*time in mRNA abundance were analyzed as repeated-measures. Data represent relative mRNA abundance, normalized against 18S abundance and are presented as LS mean ± SEM from six separate replicates utilizing BSCs isolated BSCs isolated from at least three different animals. Differences (p < 0.05) between steroidal hormones found in anabolic implants and the control cultures are indicated by a * at that particular time point.
Figure 3
Figure 3
Relative mRNA abundance of S-adenosylmethionine decarboxylase (AMD1; (A) and ornithine decarboxylase (ODC; (B) from primary bovine satellite cells cultures following treatment with 10 nM trenbolone acetate (TBA), 10 nM estradiol (E2), or 10 nM E2 and 10 nM TBA (E2/TBA). Cultures were grown to 80% confluency and treated with DMEM/3% horse serum and 10 nM TBA, 10 nM E2, or 10 nM E2/TBA. Abundance was measured 0, 2, 4, 8, 12, 24 and 48 h after treatment, as described in the Materials and Methods. The main effects of steroidal hormone, time and steroidal hormone *time in mRNA abundance were analyzed as repeated-measures. Data represent relative mRNA abundance normalized against 18S abundance and are presented as LS mean ± SEM from six separate replicates utilizing BSCs isolated BSCs isolated from at least three different animals. Differences (p < 0.05) between steroidal hormones found in anabolic implants and the control cultures are indicated by a * at that particular time point.
Figure 4
Figure 4
Relative mRNA abundance of paired box transcription factor 7 (PAX7; (A), myogenic factor 5 (MYF5; (B), and myogenic differentiation factor 1 (MYOD; (C) from primary bovine satellite cells cultures following treatment with 10 mM methionine (MET) or 8 mM ornithine (ORN). Cultures were grown to 80% confluency and treated with DMEM/3% horse serum and 10 mM MET or 8 mM ORN. Abundance was measured 0, 2, 4, 8, 12, 24 and 48 h after treatment, as described in the Materials and Methods. The main effects of polyamine precursor, time and polyamine precursor*time in mRNA abundance were analyzed as repeated-measures. Data represent relative mRNA abundance normalized against 18S abundance and are presented as LS mean ± SEM from six separate replicates utilizing BSCs isolated BSCs isolated from at least three different animals. Differences (p < 0.05) between polyamine precursors and the control cultures are indicated by a * at that particular time point.
Figure 4
Figure 4
Relative mRNA abundance of paired box transcription factor 7 (PAX7; (A), myogenic factor 5 (MYF5; (B), and myogenic differentiation factor 1 (MYOD; (C) from primary bovine satellite cells cultures following treatment with 10 mM methionine (MET) or 8 mM ornithine (ORN). Cultures were grown to 80% confluency and treated with DMEM/3% horse serum and 10 mM MET or 8 mM ORN. Abundance was measured 0, 2, 4, 8, 12, 24 and 48 h after treatment, as described in the Materials and Methods. The main effects of polyamine precursor, time and polyamine precursor*time in mRNA abundance were analyzed as repeated-measures. Data represent relative mRNA abundance normalized against 18S abundance and are presented as LS mean ± SEM from six separate replicates utilizing BSCs isolated BSCs isolated from at least three different animals. Differences (p < 0.05) between polyamine precursors and the control cultures are indicated by a * at that particular time point.
Figure 5
Figure 5
Relative mRNA abundance of S-adenosylmethionine decarboxylase (AMD1; (A) and ornithine decarboxylase (ODC; (B) from primary bovine satellite cells cultures following treatment with 10 mM methionine (MET) or 8 mM ornithine (ORN). Cultures were grown to 80% confluency and treated with DMEM/3% horse serum and 10 mM MET or 8 mM ORN. Abundance was measured 0, 2, 4, 8, 12, 24 and 48 h after treatment, as described in the Materials and Methods. The main effects of polyamine precursor, time and polyamine precursor*time in mRNA abundance were analyzed as repeated-measures. Data represent relative mRNA abundance normalized against 18S abundance and are presented as LS mean ± SEM from six separate replicates utilizing BSCs isolated BSCs isolated from at least three different animals. Differences (p < 0.05) between polyamine precursors and the control cultures are indicated by a * at that particular time point.
Figure 6
Figure 6
Relative mRNA abundance of paired box transcription factor 7 (PAX7; (A), myogenic factor 5 (MYF5; (B), and myogenic differentiation factor 1 (MYOD; (C) from primary bovine satellite cells cultures following treatment with 2 mM putrescine (PUT), 1.5 mM spermidine (SPD) or 0.5 mM spermine (SPE). Cultures were grown to 80% confluency and treated with DMEM/3% horse serum and 2 mM PUT, 1.5 mM SPD, or 0.5 mM SPE. Abundance was measured 0, 2, 4, 8, 12, 24 and 48 h after treatment, as described in the Materials and Methods. The main effects of polyamine, time and polyamine*time in mRNA abundance were analyzed as repeated-measures. Data represent relative mRNA abundance normalized against 18S abundance and are presented as LS mean ± SEM from six separate replicates utilizing BSCs isolated BSCs isolated from at least three different animals. Differences (p < 0.05) between polyamines and the control cultures are indicated by a * at that particular time point.
Figure 6
Figure 6
Relative mRNA abundance of paired box transcription factor 7 (PAX7; (A), myogenic factor 5 (MYF5; (B), and myogenic differentiation factor 1 (MYOD; (C) from primary bovine satellite cells cultures following treatment with 2 mM putrescine (PUT), 1.5 mM spermidine (SPD) or 0.5 mM spermine (SPE). Cultures were grown to 80% confluency and treated with DMEM/3% horse serum and 2 mM PUT, 1.5 mM SPD, or 0.5 mM SPE. Abundance was measured 0, 2, 4, 8, 12, 24 and 48 h after treatment, as described in the Materials and Methods. The main effects of polyamine, time and polyamine*time in mRNA abundance were analyzed as repeated-measures. Data represent relative mRNA abundance normalized against 18S abundance and are presented as LS mean ± SEM from six separate replicates utilizing BSCs isolated BSCs isolated from at least three different animals. Differences (p < 0.05) between polyamines and the control cultures are indicated by a * at that particular time point.
Figure 7
Figure 7
Relative mRNA abundance of S-adenosylmethionine decarboxylase (AMD1; A) and ornithine decarboxylase (ODC; B) from primary bovine satellite cells cultures following treatment with 2 mM putrescine (PUT), 1.5 mM spermidine (SPD) or 0.5 mM spermine (SPE). Cultures were grown to 80% confluency and treated with DMEM/3% horse serum and 2 mM PUT, 1.5 mM SPD, or 0.5 mM SPE. Cultures were grown to 80% confluency and treated with DMEM/3% horse serum and 10 nM TBA, 10 nM E2, or 10 nM E2/TBA. Abundance was measured 0, 2, 4, 8, 12, 24 and 48 h after treatment, as described in the Materials and Methods. The main effects of polyamine, time and polyamine*time in mRNA abundance were analyzed as repeated-measures. Data represent relative mRNA abundance normalized against 18S abundance and are presented as LS mean ± SEM from six separate replicates utilizing BSCs isolated BSCs isolated from at least three different animals. Differences (p < 0.05) between polyamines and the control cultures are indicated by a * at that particular time point.

Similar articles

Cited by

References

    1. Thornton K.J. Triennial Growth Symposium: The Nutrition of Muscle Growth: Impacts of nutrition on the proliferation and differentiation of satellite cells in livestock species. J. Anim. Sci. 2019;29:2258–2269. doi: 10.1093/jas/skz081. - DOI - PMC - PubMed
    1. England E., Scheffler T., Kasten S., Matarneh S., Gerrard D. Exploring the unknowns involved in the transformation of muscle to meat. Meat Sci. 2013;95:837–843. doi: 10.1016/j.meatsci.2013.04.031. - DOI - PubMed
    1. Capper J.L., Hayes D.J. The environmental and economic impact of removing growth-enhancing tech-nologies from US beef production. J. Anim. Sci. 2012;90:3527–3537. doi: 10.2527/jas.2011-4870. - DOI - PubMed
    1. Hawke T.J., Garry D.J. Myogenic satellite cells: Physiology to molecular biology. J. Appl. Physiol. 2001;91:534–551. doi: 10.1152/jappl.2001.91.2.534. - DOI - PubMed
    1. Li J., Gonzalez J.M., Walker D.K., Hersom M.J., Ealy A.D., Johnson S.E. Evidence of heterogeneity within bovine satellite cells isolated from young and adult animals. J. Anim. Sci. 2011;89:1751–1757. doi: 10.2527/jas.2010-3568. - DOI - PubMed

LinkOut - more resources