

The Geography of the Covid-19 Pandemic: A Data-Driven Approach to Exploring Geographical Driving Forces
- PMID: 33802001
- PMCID: PMC7998460
- DOI: 10.3390/ijerph18062803
The Geography of the Covid-19 Pandemic: A Data-Driven Approach to Exploring Geographical Driving Forces
Abstract
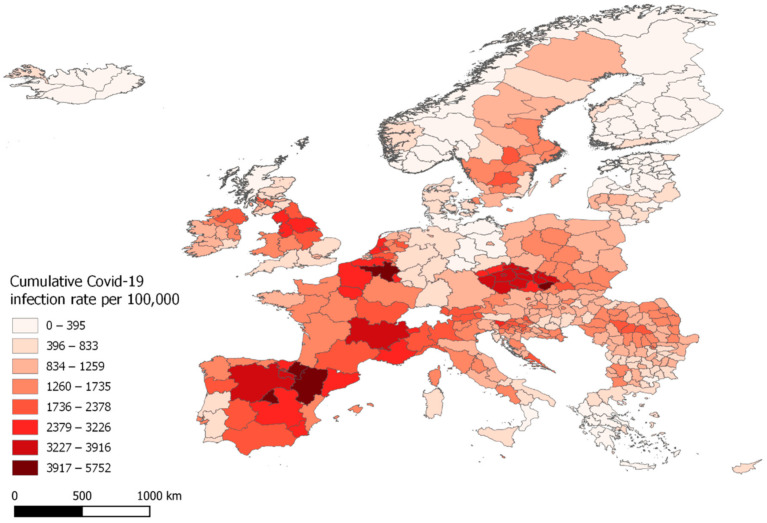
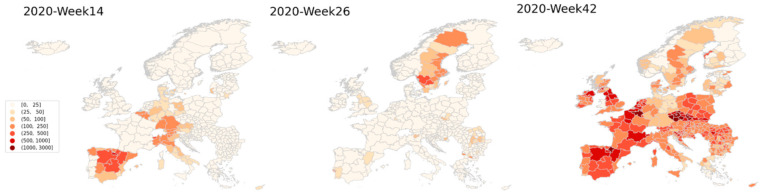
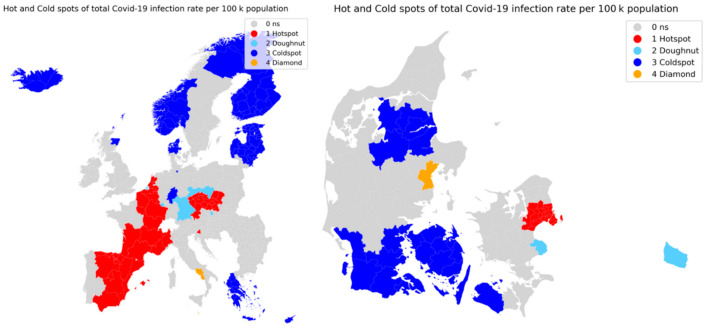
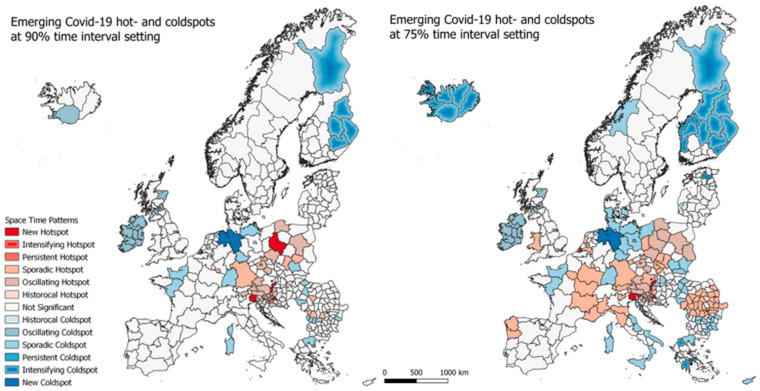
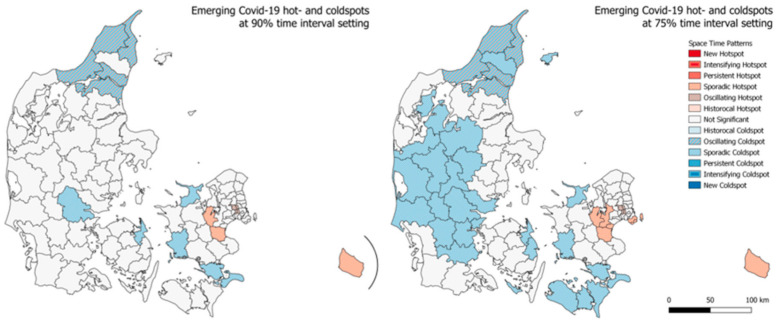
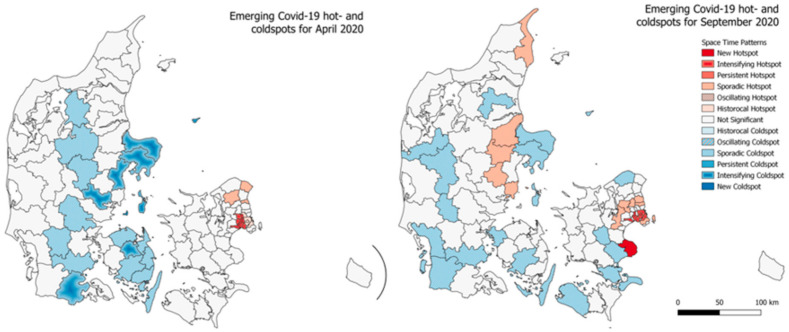
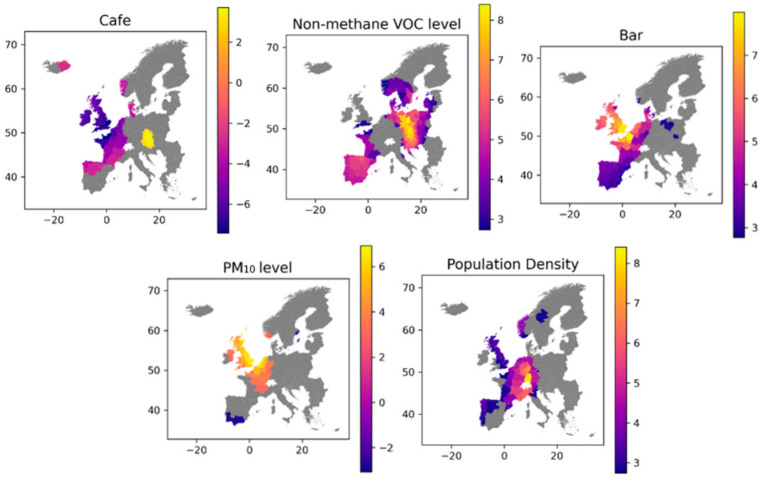
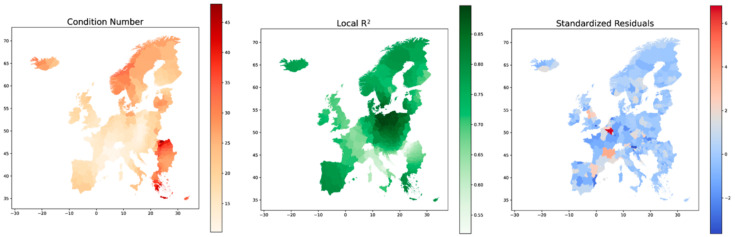
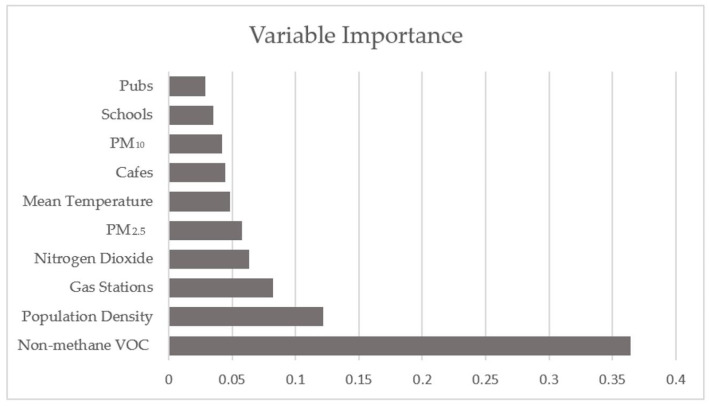
The Covid-19 pandemic emerged and evolved so quickly that societies were not able to respond quickly enough, mainly due to the nature of the Covid-19 virus' rate of spread and also the largely open societies that we live in. While we have been willingly moving towards open societies and reducing movement barriers, there is a need to be prepared for minimizing the openness of society on occasions such as large pandemics, which are low probability events with massive impacts. Certainly, similar to many phenomena, the Covid-19 pandemic has shown us its own geography presenting its emergence and evolving patterns as well as taking advantage of our geographical settings for escalating its spread. Hence, this study aims at presenting a data-driven approach for exploring the spatio-temporal patterns of the pandemic over a regional scale, i.e., Europe and a country scale, i.e., Denmark, and also what geographical variables potentially contribute to expediting its spread. We used official regional infection rates, points of interest, temperature and air pollution data for monitoring the pandemic's spread across Europe and also applied geospatial methods such as spatial autocorrelation and space-time autocorrelation to extract relevant indicators that could explain the dynamics of the pandemic. Furthermore, we applied statistical methods, e.g., ordinary least squares, geographically weighted regression, as well as machine learning methods, e.g., random forest for exploring the potential correlation between the chosen underlying factors and the pandemic spread. Our findings indicate that population density, amenities such as cafes and bars, and pollution levels are the most influential explanatory variables while pollution levels can be explicitly used to monitor lockdown measures and infection rates at country level. The choice of data and methods used in this study along with the achieved results and presented discussions can empower health authorities and decision makers with an interactive decision support tool, which can be useful for imposing geographically varying lockdowns and protectives measures using historical data.
Keywords: Covid-19 pandemic; machine learning; public health; spatial autocorrelation; spatio-temporal analysis.
Conflict of interest statement
The authors declare no conflict of interest.
Figures


References
-
- World Health Organization Weekly Epidemiological Update 29 December 2020. [(accessed on 1 March 2021)];2020 Available online: https://www.who.int/publications/m/item/weekly-epidemiological-update.
-
- UN-Habitat UN-Habitat COVID-19 Response Plan. [(accessed on 11 July 2020)];2020 Available online: https://unhabitat.org/sites/default/files/2020/04/final_un-habitat_covid....
-
- Rose-Redwood R., Kitchin R., Apostolopoulou E., Rickards L., Blackman T., Crampton J., Rossi U., Buckley M. Geographies of the COVID-19 pandemic. Dialog Hum. Geogr. 2020;10:97–106. doi: 10.1177/2043820620936050. - DOI
Publication types
MeSH terms
Grants and funding
LinkOut - more resources
Full Text Sources
Other Literature Sources
Medical
