

The Combination of Neutrophil-Lymphocyte Ratio and Platelet-Lymphocyte Ratio with Liquid Biopsy Biomarkers Improves Prognosis Prediction in Metastatic Pancreatic Cancer
- PMID: 33802006
- PMCID: PMC7998484
- DOI: 10.3390/cancers13061210
The Combination of Neutrophil-Lymphocyte Ratio and Platelet-Lymphocyte Ratio with Liquid Biopsy Biomarkers Improves Prognosis Prediction in Metastatic Pancreatic Cancer
Abstract
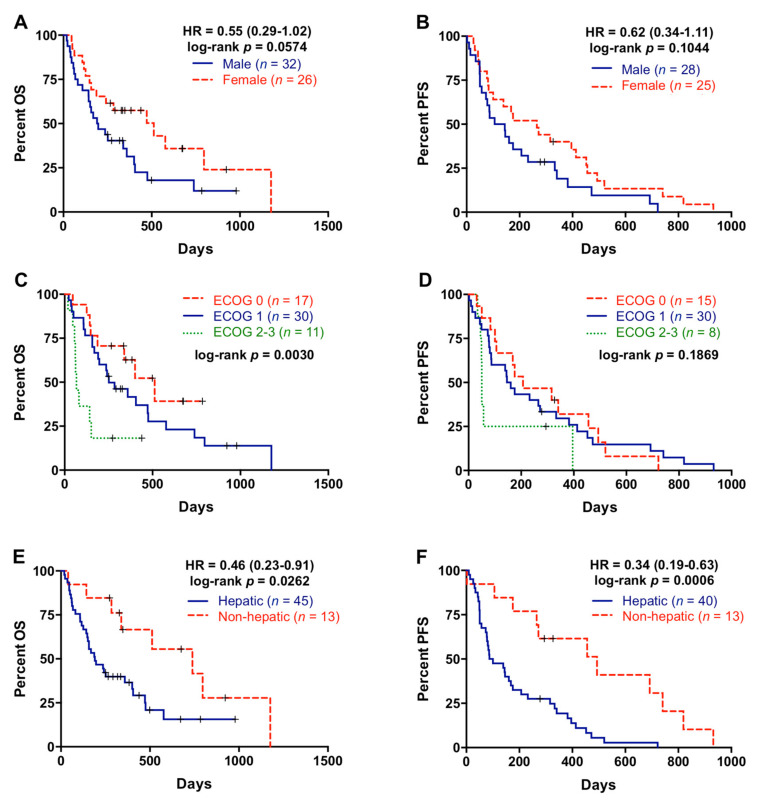
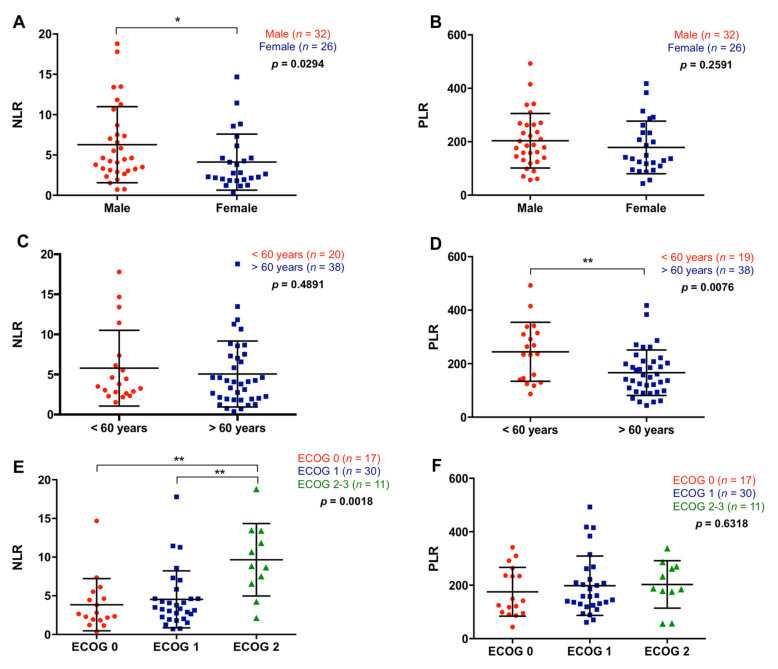
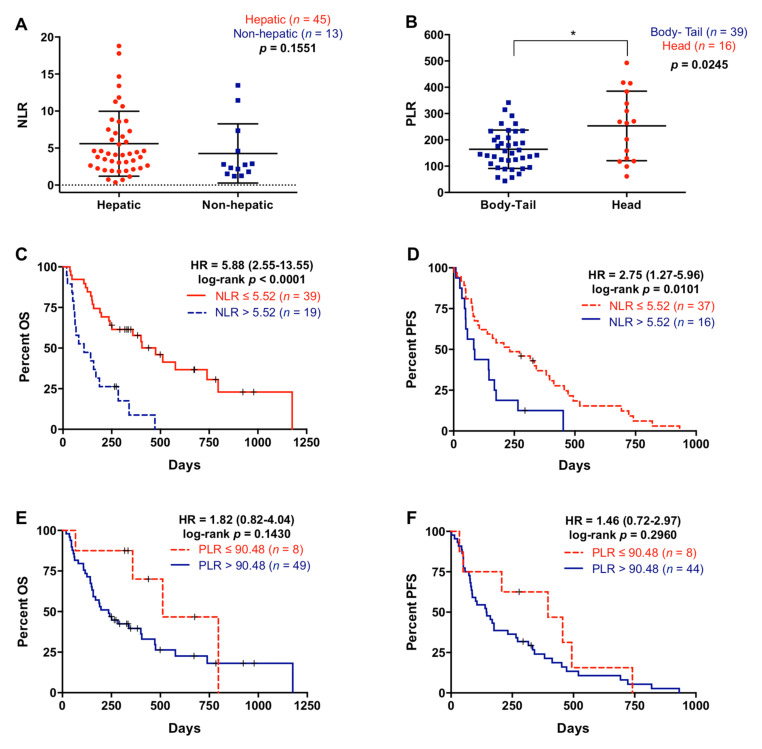
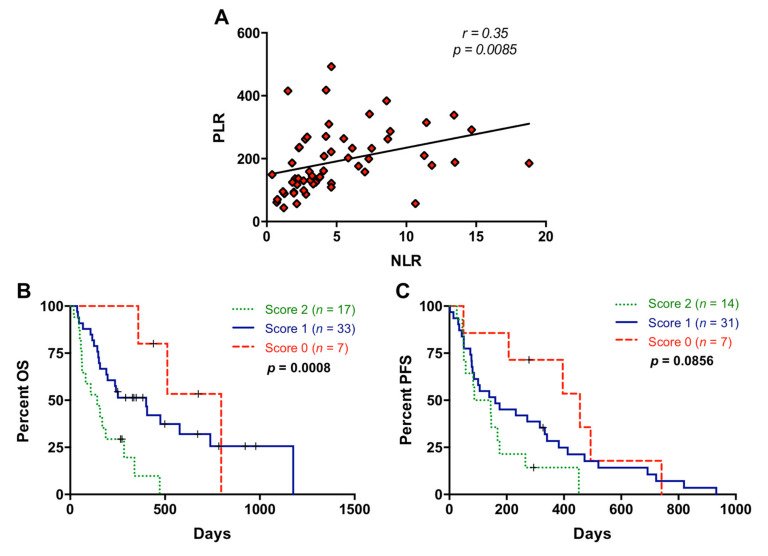
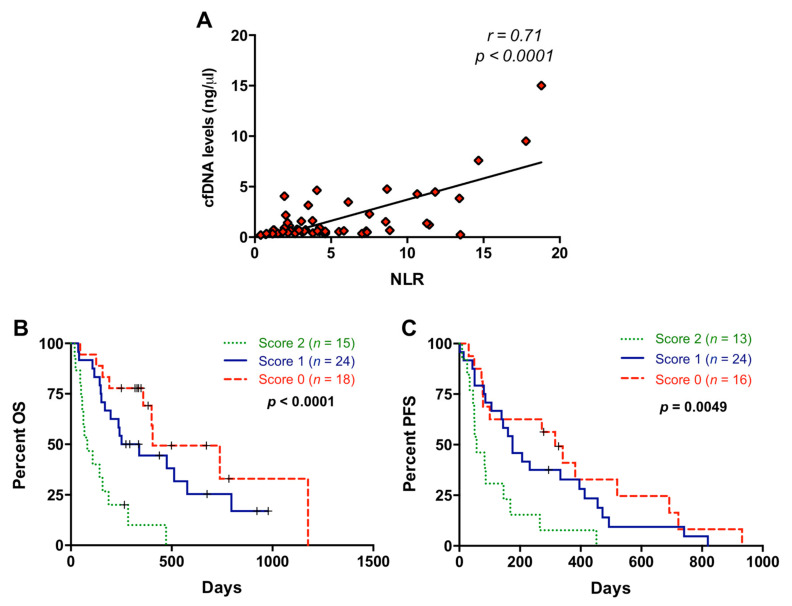
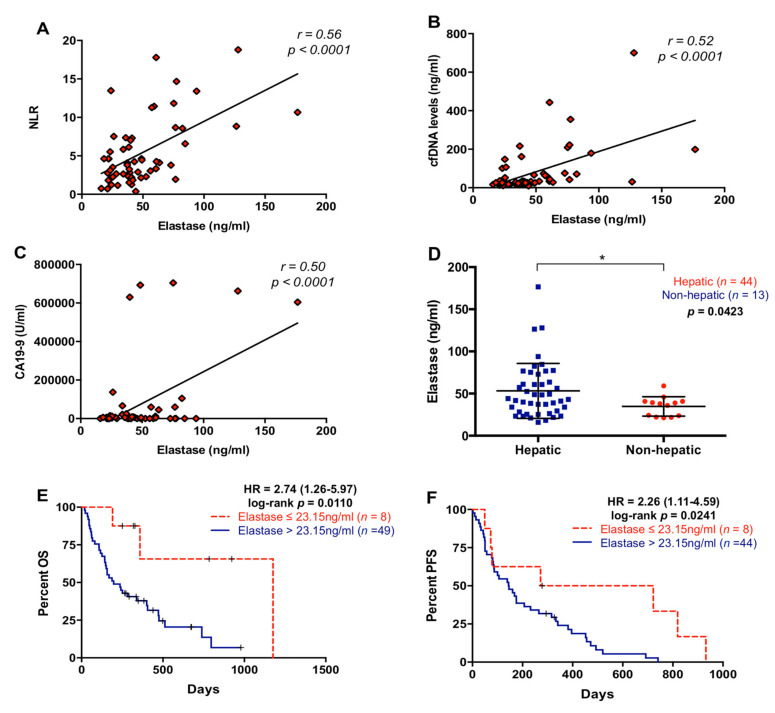
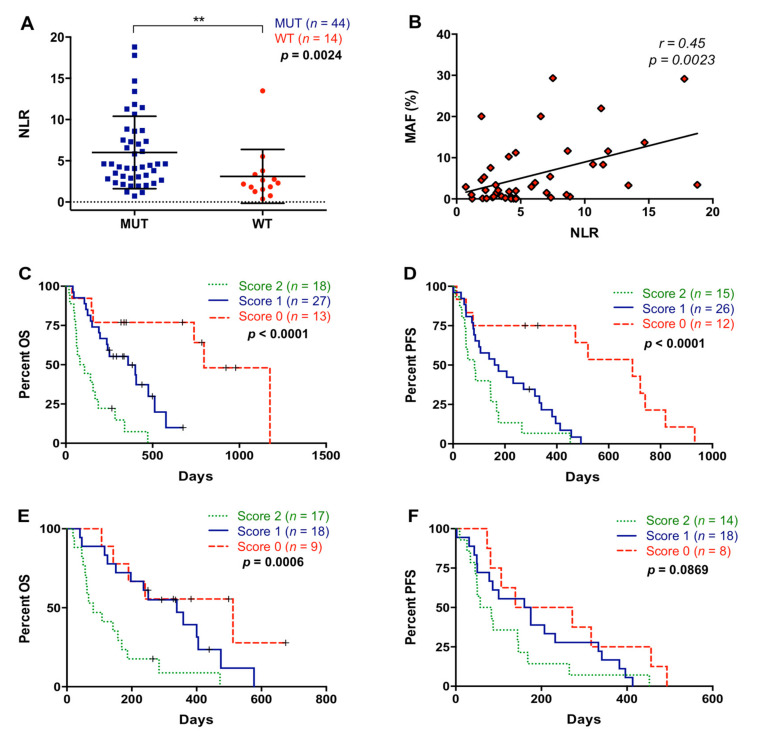
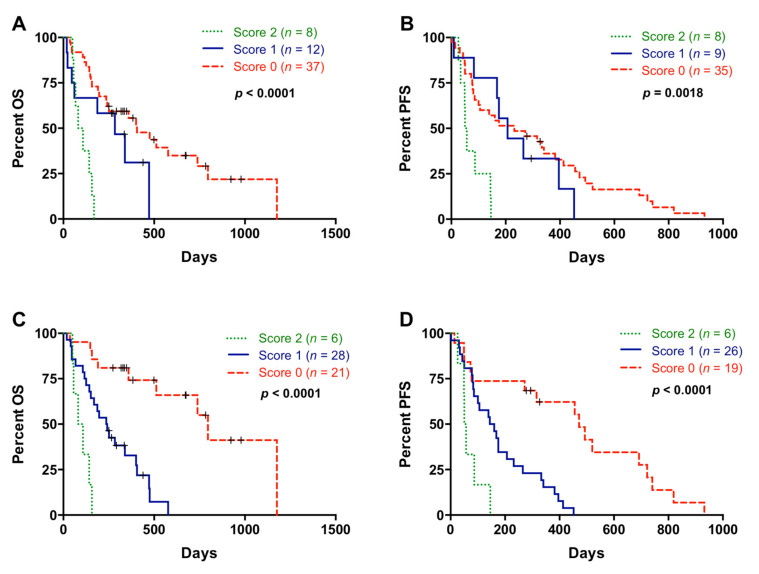
Pancreatic ductal adenocarcinoma (PDAC) is an aggressive cancer with a highly inflammatory microenvironment and liquid biopsy has emerged as a promising tool for the noninvasive analysis of this tumor. In this study, plasma was obtained from 58 metastatic PDAC patients, and neutrophil-lymphocyte ratio (NLR), platelet-lymphocyte ratio (PLR), circulating cell-free DNA (cfDNA) concentration, and circulating RAS mutation were determined. We found that NLR was significantly associated with both overall survival (OS) and progression-free survival. Remarkably, NLR was an independent risk factor for poor OS. Moreover, NLR and PLR positively correlated, and combination of both inflammatory markers significantly improved the prognostic stratification of metastatic PDAC patients. NLR also showed a positive correlation with cfDNA levels and RAS mutant allelic fraction (MAF). Besides, we found that neutrophil activation contributed to cfDNA content in the plasma of metastatic PDAC patients. Finally, a multi-parameter prognosis model was designed by combining NLR, PLR, cfDNA levels, RAS mutation, RAS MAF, and CA19-9, which performs as a promising tool to predict the prognosis of metastatic PDAC patients. In conclusion, our study supports the idea that the use of systemic inflammatory markers along with circulating tumor-specific markers may constitute a valuable tool for the clinical management of metastatic PDAC patients.
Keywords: NLR; PLR; RAS mutation; circulating tumor DNA; neutrophil elastase; pancreatic ductal adenocarcinoma.
Conflict of interest statement
The authors declare no conflict of interest.
Figures
Similar articles
-
Circulating Cell-Free DNA-Based Liquid Biopsy Markers for the Non-Invasive Prognosis and Monitoring of Metastatic Pancreatic Cancer.Cancers (Basel). 2020 Jul 1;12(7):1754. doi: 10.3390/cancers12071754. Cancers (Basel). 2020. PMID: 32630266 Free PMC article.
-
Preoperative independent prognostic factors in patients with borderline resectable pancreatic ductal adenocarcinoma following curative resection: the neutrophil-lymphocyte and platelet-lymphocyte ratios.Surg Today. 2016 May;46(5):583-92. doi: 10.1007/s00595-015-1206-3. Epub 2015 Jun 25. Surg Today. 2016. PMID: 26108488
-
Neutrophil to lymphocyte ratio, not platelet to lymphocyte or lymphocyte to monocyte ratio, is predictive of patient survival after resection of early-stage pancreatic ductal adenocarcinoma.BMC Cancer. 2020 Aug 11;20(1):750. doi: 10.1186/s12885-020-07182-9. BMC Cancer. 2020. PMID: 32782024 Free PMC article.
-
Meta-Analysis of Circulating Cell-Free DNA's Role in the Prognosis of Pancreatic Cancer.Cancers (Basel). 2021 Jul 6;13(14):3378. doi: 10.3390/cancers13143378. Cancers (Basel). 2021. PMID: 34298594 Free PMC article. Review.
-
Circulating inflammatory cells in patients with metastatic breast cancer: Implications for treatment.Front Oncol. 2022 Aug 8;12:882896. doi: 10.3389/fonc.2022.882896. eCollection 2022. Front Oncol. 2022. PMID: 36003772 Free PMC article. Review.
Cited by
-
The prognostic value of preoperative peripheral blood inflammatory biomarkers in extrahepatic cholangiocarcinoma: a systematic review and meta-analysis.Front Oncol. 2024 Aug 29;14:1437978. doi: 10.3389/fonc.2024.1437978. eCollection 2024. Front Oncol. 2024. PMID: 39267826 Free PMC article.
-
Establishment of a nomogram based on Lasso Cox regression for albumin combined with systemic immune-inflammation index score to predict prognosis in advanced pancreatic carcinoma.Front Oncol. 2025 Apr 8;15:1447055. doi: 10.3389/fonc.2025.1447055. eCollection 2025. Front Oncol. 2025. PMID: 40265018 Free PMC article.
-
Pancreatic melatonin enhances anti-tumor immunity in pancreatic adenocarcinoma through regulating tumor-associated neutrophils infiltration and NETosis.Acta Pharm Sin B. 2023 Apr;13(4):1554-1567. doi: 10.1016/j.apsb.2023.01.020. Epub 2023 Feb 2. Acta Pharm Sin B. 2023. PMID: 37139434 Free PMC article.
-
Prognostic value of systemic immune-inflammation index for patients undergoing radical prostatectomy: a systematic review and meta-analysis.Front Immunol. 2025 Feb 4;16:1465971. doi: 10.3389/fimmu.2025.1465971. eCollection 2025. Front Immunol. 2025. PMID: 39967666 Free PMC article.
-
Prognostic value of neutrophil to lymphocyte ratio in patients with advanced pancreatic ductal adenocarcinoma treated with systemic chemotherapy.Ann Med. 2024 Dec;56(1):2398725. doi: 10.1080/07853890.2024.2398725. Epub 2024 Sep 2. Ann Med. 2024. PMID: 39221763 Free PMC article.
References
Grants and funding
LinkOut - more resources
Full Text Sources
Other Literature Sources
