. 2021 Mar 10;11(3):491.
doi: 10.3390/diagnostics11030491.

Combined COX-2/PPARγ Expression as Independent Negative Prognosticator for Vulvar Cancer Patients

Affiliations

Combined COX-2/PPARγ Expression as Independent Negative Prognosticator for Vulvar Cancer Patients

Nadine Ansorge et al. Diagnostics (Basel). .

Abstract

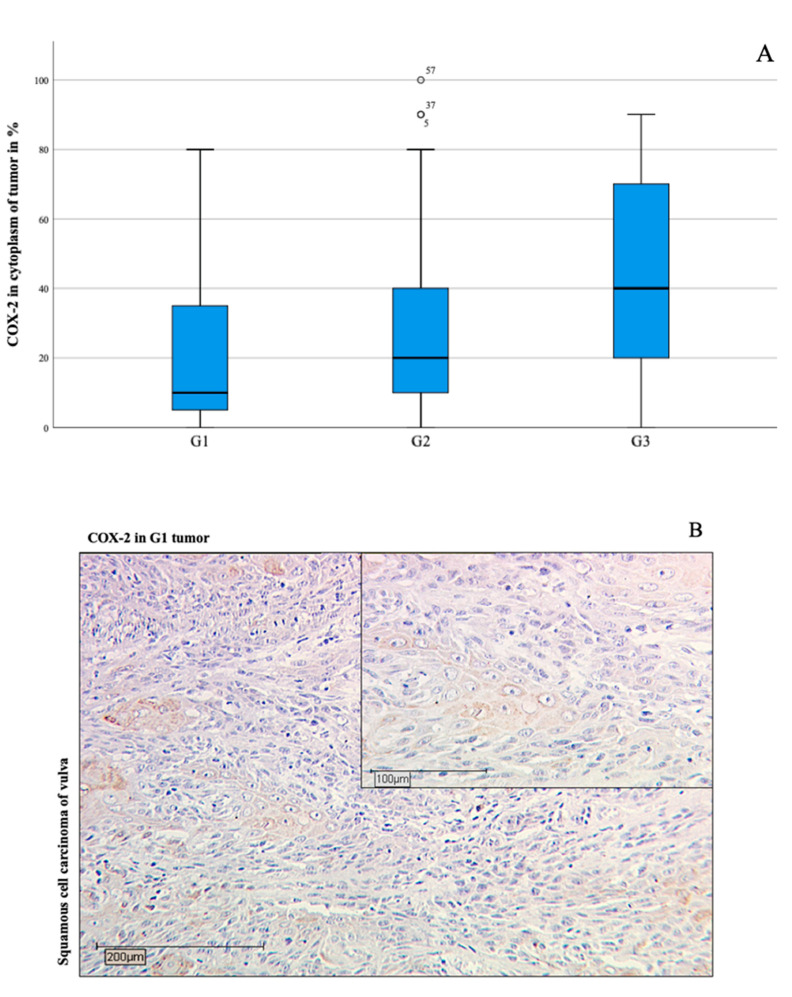
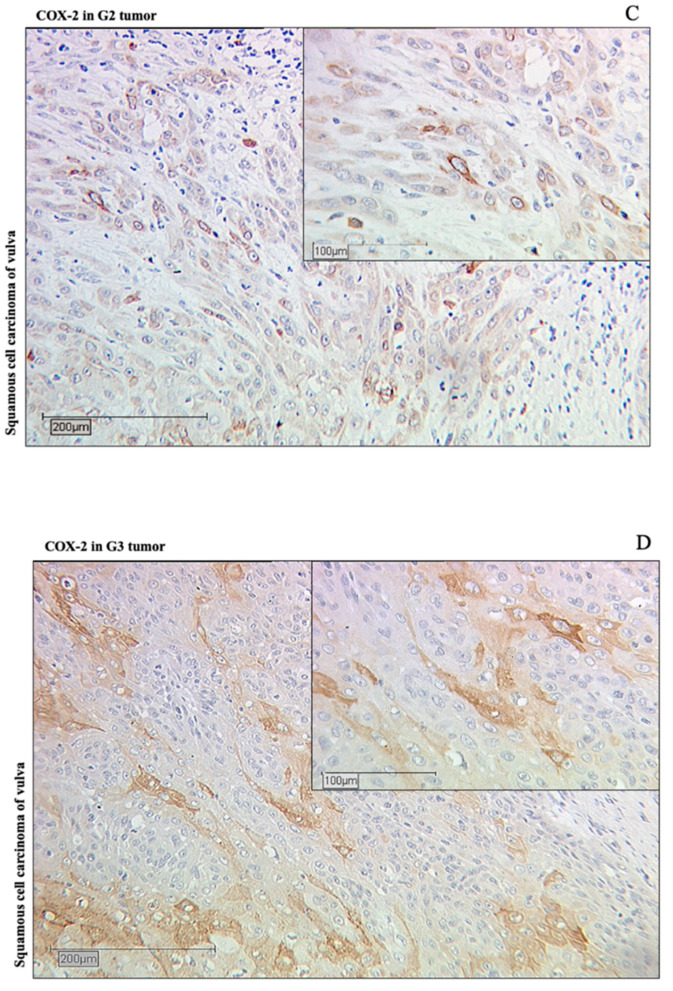
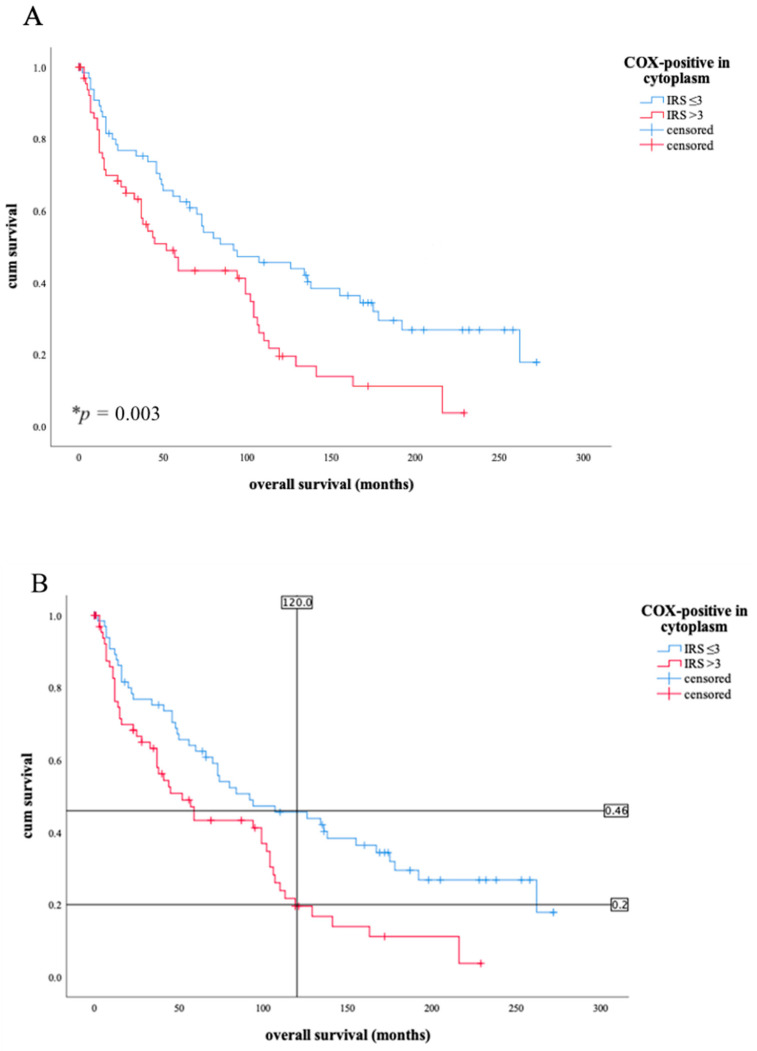
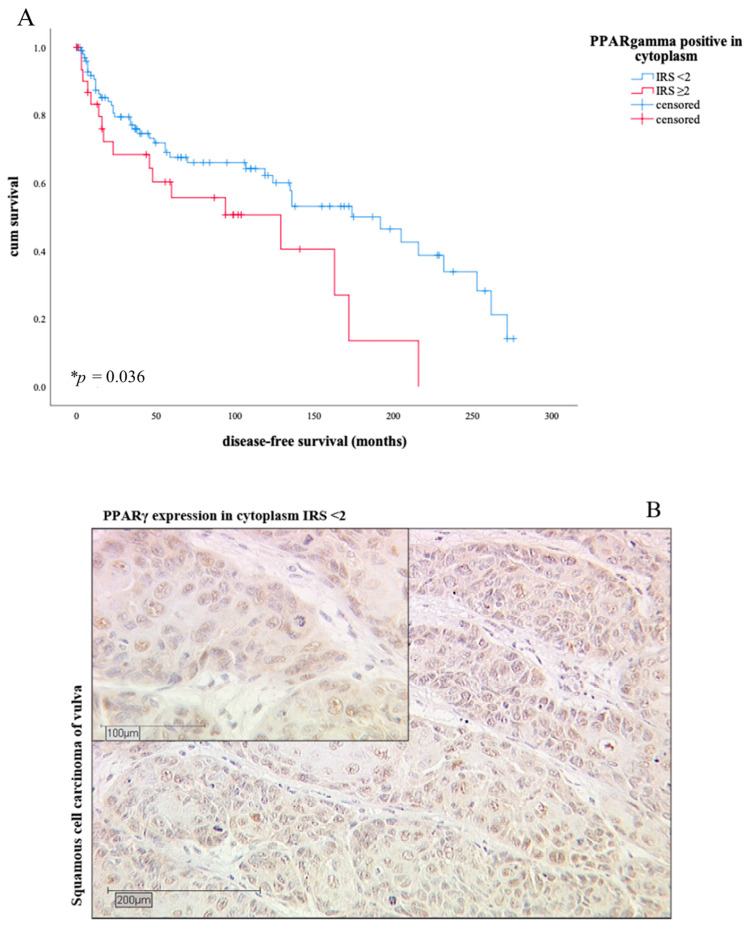
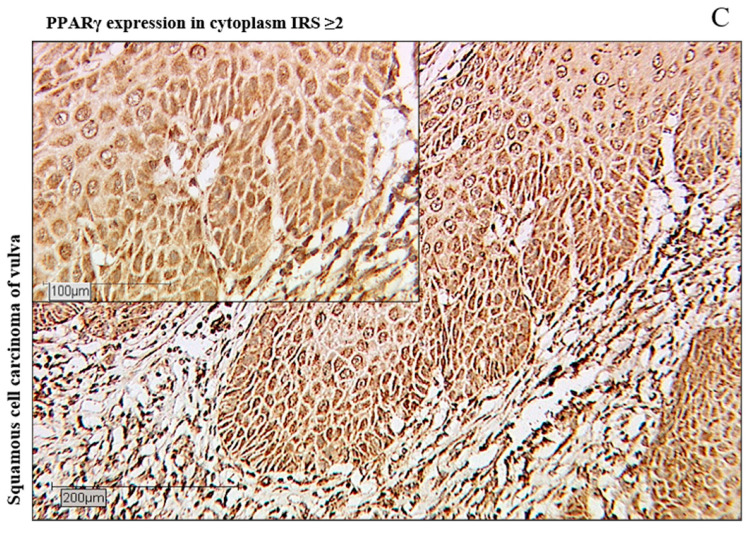
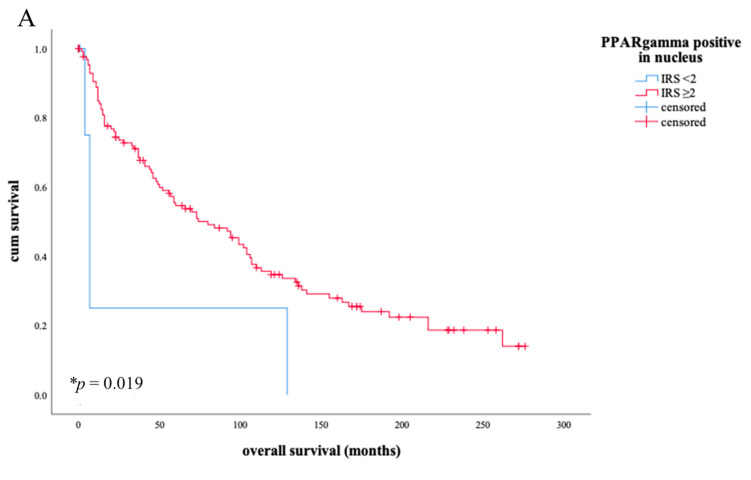
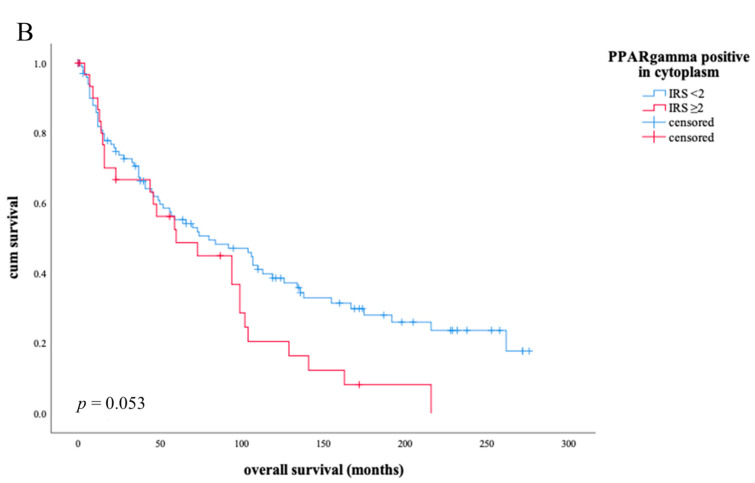
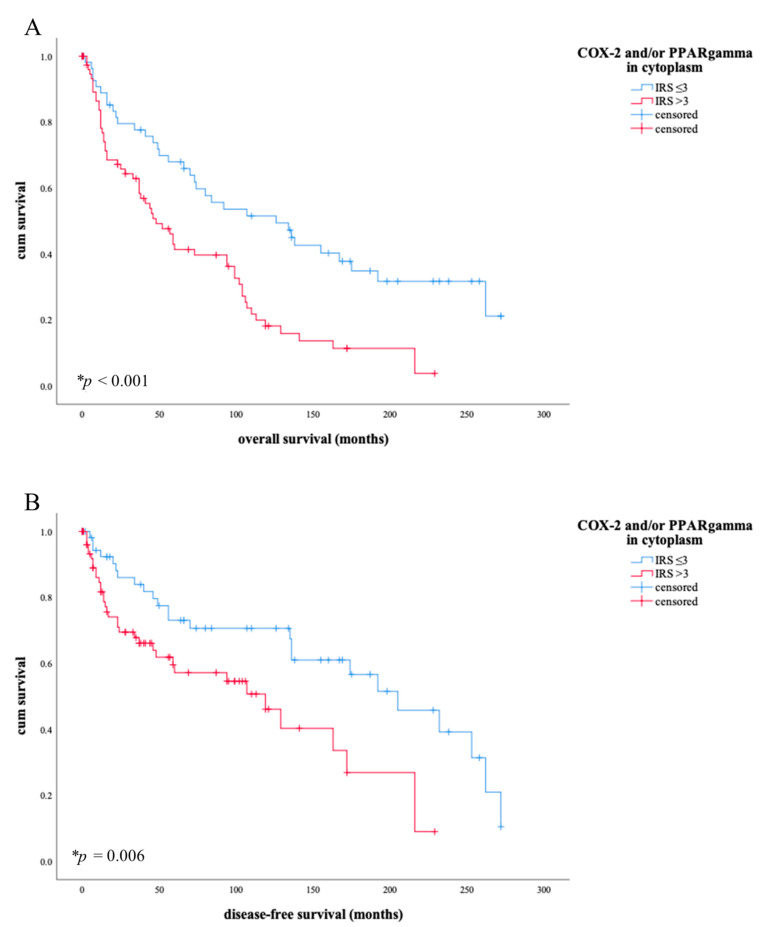
Vulvar cancer incidence numbers have been rising steadily over the past decades. Especially the number of young patients with vulvar cancer increased recently. Therefore, the need to identify new prognostic factors for vulvar carcinoma is more apparent. Cyclooxygenase-2 (COX-2) has long been an object of scientific interest in the context of carcinogenesis. This enzyme is involved in prostaglandin synthesis and the latter binds to nuclear receptors like PPARγ. Therefore, the aim of this study was to investigate COX-2- and PPARγ- expression in tissues of vulvar carcinomas and to analyze their relevance as prognostic factors. The cytoplasmatic expression of COX-2 as well as PPARγ is associated with a significantly reduced survival, whereas nuclear expression of PPARγ results in a better survival. Especially the combined expression of both COX-2 and PPARγ in the cytoplasm is an independent negative prognosticator for vulvar cancer patients.

Keywords: COX-2; PPARγ; survival; vulvar cancer.


Conflict of interest statement

S.M. received research support, advisory board, honoraria and travel expenses from AstraZeneca, Clovis, Medac, MSD, PharmaMar, Roche, Sensor Kinesis, Tesaro and Teva. F.T. declares research support, advisory board, honoraria and travel expenses from AstraZeneca, Medac, PharmaMar, Roche and Tesaro. All other authors declare no conflict of interest. The funders had no role in the design of the study; in the collection, analyses, or interpretation of data; in the writing of the manuscript, or in the decision to publish the results.

Figures

Figure 1
Figure 1
Boxplots (A) presenting positive correlation (* p = 0.001 in Spearman-Rho) between COX-2 positive tissue amount and the individual degree of tumor grading (G1: well-differentiated for (B), G2: moderately-differentiated for (C), G3: poorly-differentiated for (D)). The boxplots indicate mild outliers, which are marked with circles. These outliers show an interquartile distance to the third quartile of values that is less than three times higher than the third quartile of values. The numbers on the circles denote the cases (case numbers 5, 37, 57) in concern. Immunohistochemistry staining of cytoplasmic COX-2 (10× and 25× magnification) showing correlation to Grading 1–3 with increase of COX-2 intensity in vulvar cancer (BD). The medians of the percentage COX-2 expression shown in the boxplots of the individual grading categories are represented in the immunohistochemical images of (BD) (amount 10% in (B), amount 20% in (C), and amount 40% in (D)).
Figure 1
Figure 1
Boxplots (A) presenting positive correlation (* p = 0.001 in Spearman-Rho) between COX-2 positive tissue amount and the individual degree of tumor grading (G1: well-differentiated for (B), G2: moderately-differentiated for (C), G3: poorly-differentiated for (D)). The boxplots indicate mild outliers, which are marked with circles. These outliers show an interquartile distance to the third quartile of values that is less than three times higher than the third quartile of values. The numbers on the circles denote the cases (case numbers 5, 37, 57) in concern. Immunohistochemistry staining of cytoplasmic COX-2 (10× and 25× magnification) showing correlation to Grading 1–3 with increase of COX-2 intensity in vulvar cancer (BD). The medians of the percentage COX-2 expression shown in the boxplots of the individual grading categories are represented in the immunohistochemical images of (BD) (amount 10% in (B), amount 20% in (C), and amount 40% in (D)).
Figure 2
Figure 2
As the Kaplan-Meier curve shows, patients with cytoplasmatic COX-2 expression according to immunoreactive score (IRS) > 3 survive for a shorter time period than patients with a lower IRS ((A), * p = 0.003). The blue line shows the survival curve of patients with COX-2 expression of IRS level ≤ 3, the red line shows the survival curve of patients with COX-2 expression IRS level above. The 10 year survival ((B), 120 months signed with vertical line) of a patient with IRS > 3 is about half as high as that of a patient with lower IRS. The horizontal lines in (B) illustrate the points of intersection on the Kaplan-Meier curves: IRS values above 3 show that 20% of patients live after 10 years; IRS values below 3 demonstrate that 46% of patients survive after the same time.
Figure 3
Figure 3
As the Kaplan-Meier curve (A) shows, patients with cytoplasmic PPARγ expression according to IRS ≥ 2 survive a shorter time than patients with a lower IRS (* p = 0.036). The blue line shows the survival curve of patients with PPARγ expression of IRS level under 2, the red line shows the survival curve of patients with PPARγ expression IRS level ≥ 2. (B) shows an example of low expression level of PPARγ in cytoplasm (IRS < 2), (C) represent a high expression level of PPARγ (IRS ≥ 2) in cytoplasm, in contrast.
Figure 3
Figure 3
As the Kaplan-Meier curve (A) shows, patients with cytoplasmic PPARγ expression according to IRS ≥ 2 survive a shorter time than patients with a lower IRS (* p = 0.036). The blue line shows the survival curve of patients with PPARγ expression of IRS level under 2, the red line shows the survival curve of patients with PPARγ expression IRS level ≥ 2. (B) shows an example of low expression level of PPARγ in cytoplasm (IRS < 2), (C) represent a high expression level of PPARγ (IRS ≥ 2) in cytoplasm, in contrast.
Figure 4
Figure 4
As the Kaplan-Meier curve illustrates, an IRS value ≥2 of the nuclear PPARγ expression is related to a longer overall survival than in patients with lower values ((A), * p = 0.019). Here, a prognostic survival advantage is shown in contrast to the contrary trend in the Kaplan-Meier curve in Figure 4B. The blue line in Figure 4A shows the survival curve of patients with nuclear PPARγ expression of IRS level under 2, the red line shows the survival curve of patients with nuclear PPARγ expression IRS level ≥2. (B) reveals an opposite trend in the overall survival curve as soon as PPARγ expression is detected in the cytoplasm rather than in the nucleus (B), p = 0.053). The blue line in (B) shows the survival curve of patients with PPARγ expression in cytoplasm of IRS level under 2, the red line shows the survival curve of patients with PPARγ expression in cytoplasm of IRS level ≥ 2.
Figure 4
Figure 4
As the Kaplan-Meier curve illustrates, an IRS value ≥2 of the nuclear PPARγ expression is related to a longer overall survival than in patients with lower values ((A), * p = 0.019). Here, a prognostic survival advantage is shown in contrast to the contrary trend in the Kaplan-Meier curve in Figure 4B. The blue line in Figure 4A shows the survival curve of patients with nuclear PPARγ expression of IRS level under 2, the red line shows the survival curve of patients with nuclear PPARγ expression IRS level ≥2. (B) reveals an opposite trend in the overall survival curve as soon as PPARγ expression is detected in the cytoplasm rather than in the nucleus (B), p = 0.053). The blue line in (B) shows the survival curve of patients with PPARγ expression in cytoplasm of IRS level under 2, the red line shows the survival curve of patients with PPARγ expression in cytoplasm of IRS level ≥ 2.
Figure 5
Figure 5
When COX-2/PPARγ is expressed with IRS in cytoplasm >3, a shorter overall survival ((A), * p < 0.001) but also with regard to disease-free survival (B), * p = 0.006) can be derived. The blue line in (A) shows the overall survival of patients with COX-2/PPARγ expression in cytoplasm of IRS level ≤ 3, the red line shows the survival curve of patients with COX-2/PPARγ expression in cytoplasm of IRS level above 3. The blue line in (B) shows disease-free survival of patients with COX-2/PPARγexpression in cytoplasm of IRS level ≤ 3, the red line shows the survival curve of patients with PPARγexpression in cytoplasm of IRS level above 3. After 10 years, more than twice as many patients (0.5) live with lower IRS values than patients with expression of one or both factors (0.21) after IRS > 3. The situation is similar in disease-free survival: lower expression of COX-2 and/or PPARγ shows longer disease-free survival (0.7) than with higher expression of one or both factors (0.49).

Similar articles

Cited by

References

    1. International Agency for Research on Cancer Globocon 2018, Cancer/Vulva (C51). World Health Organization. [(accessed on 12 August 2020)]; Available online: https://gco.iarc.fr/today/data/factsheets/cancers/21-Vulva-fact-sheet.pd....
    1. Woodruff J.D., Julian C., Puray T., Mermut S., Katayama P. The contemporary challenge of carcinoma in situ of the vulva. Am. J. Obstet. Gynecol. 1973;115:677–686. doi: 10.1016/0002-9378(73)90616-9. - DOI - PubMed
    1. Kang Y.J., Smith M., Barlow E., Coffey K., Hacker N., Canfell K. Vulvar cancer in high-income countries: Increasing burden of disease. Int. J. Cancer. 2017;141:2174–2186. doi: 10.1002/ijc.30900. - DOI - PubMed
    1. Nuovo G.J., Delvenne P., MacConnell P., Chalas E., Neto C., Mann W.J. Correlation of histology and detection of human papillomavirus DNA in vulvar cancers. Gynecol. Oncol. 1991;43:275–280. doi: 10.1016/0090-8258(91)90035-4. - DOI - PubMed
    1. Madeleine M.M., Daling J.R., Carter J.J., Wipf G.C., Schwartz S.M., McKnight B., Kurman R.J., Beckmann A.M., Hagensee M.E., Galloway D.A. Cofactors with human papillomavirus in a population-based study of vulvar cancer. J. Natl. Cancer Inst. 1997;89:1516–1523. doi: 10.1093/jnci/89.20.1516. - DOI - PubMed

LinkOut - more resources