. 2021 Mar 3;13(5):1079.
doi: 10.3390/cancers13051079.

EphB6 Regulates TFEB-Lysosomal Pathway and Survival of Disseminated Indolent Breast Cancer Cells

Affiliations

EphB6 Regulates TFEB-Lysosomal Pathway and Survival of Disseminated Indolent Breast Cancer Cells

Manuela Zangrossi et al. Cancers (Basel). .

Abstract

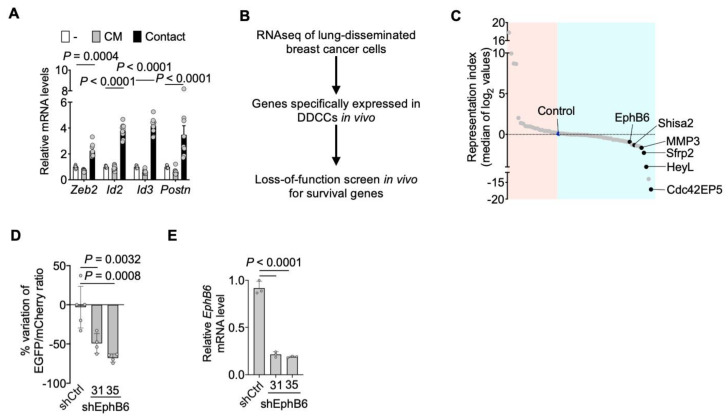
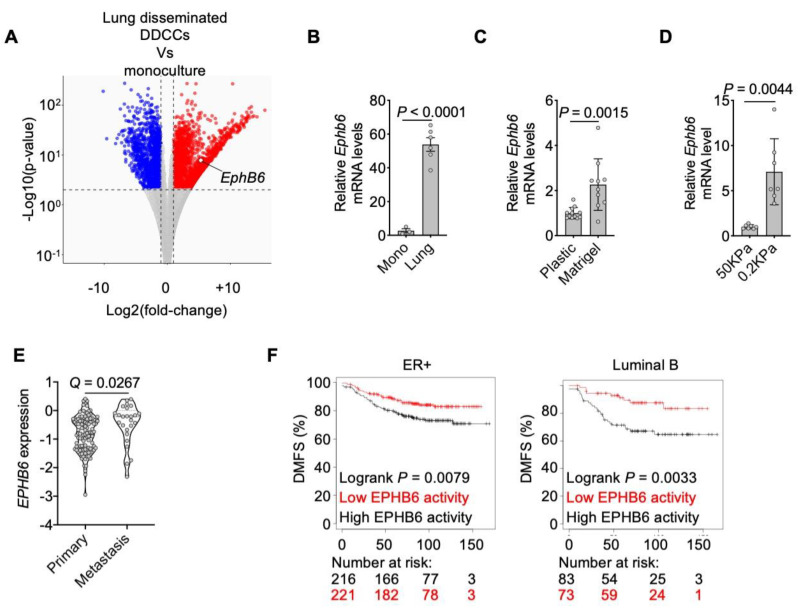
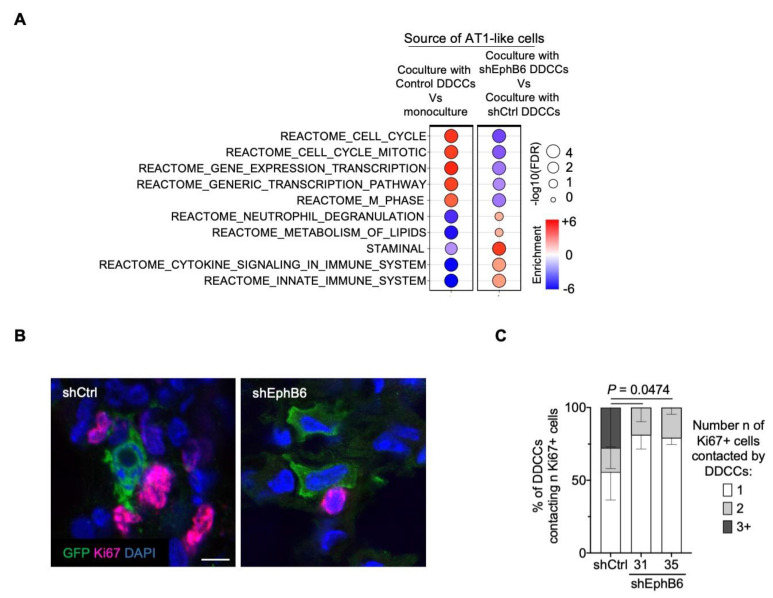
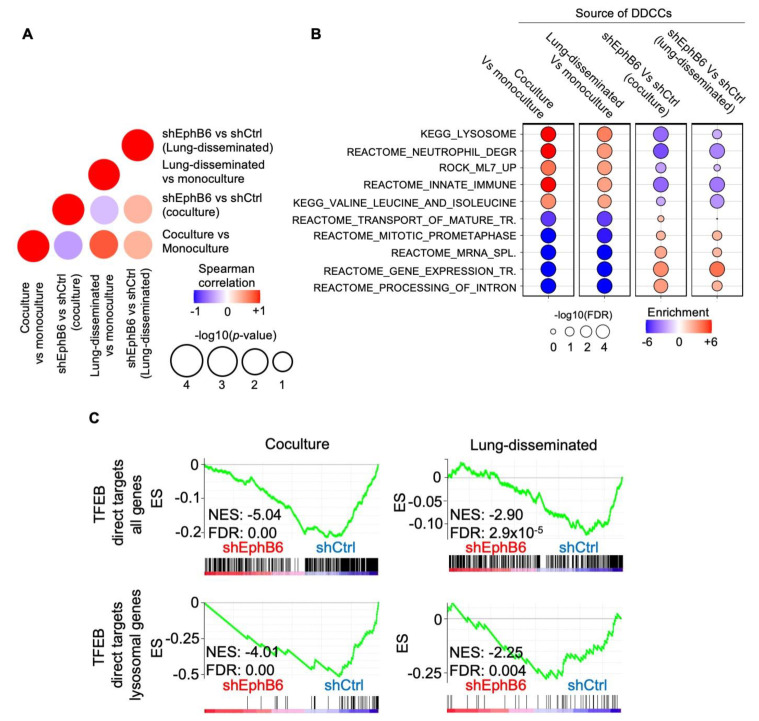
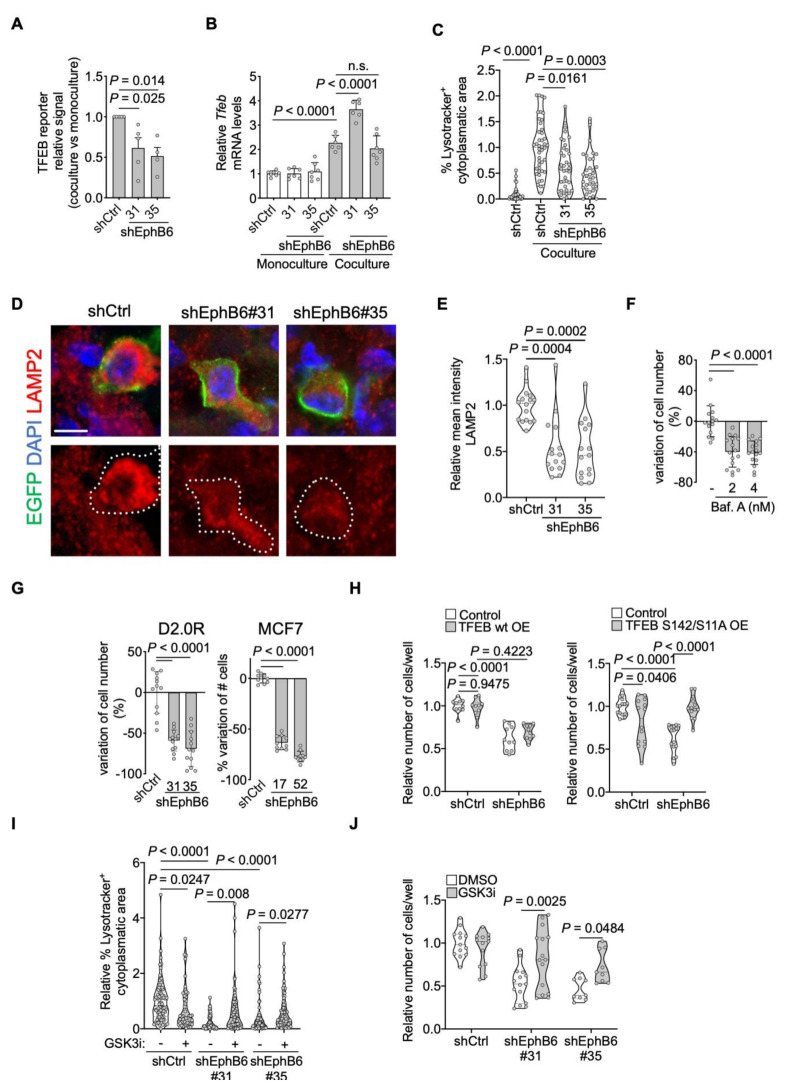
Late relapse of disseminated cancer cells is a common feature of breast and prostate tumors. Several intrinsic and extrinsic factors have been shown to affect quiescence and reawakening of disseminated dormant cancer cells (DDCCs); however, the signals and processes sustaining the survival of DDCCs in a foreign environment are still poorly understood. We have recently shown that crosstalk with lung epithelial cells promotes survival of DDCCs of estrogen receptor-positive (ER+) breast tumors. By using a lung organotypic system and in vivo dissemination assays, here we show that the TFEB-lysosomal axis is activated in DDCCs and that it is modulated by the pro-survival ephrin receptor EphB6. TFEB lysosomal direct targets are enriched in DDCCs in vivo and correlate with relapse in ER+ breast cancer patients. Direct coculture of DDCCs with alveolar type I-like lung epithelial cells and dissemination in the lung drive lysosomal accumulation and EphB6 induction. EphB6 contributes to survival, TFEB transcriptional activity, and lysosome formation in DDCCs in vitro and in vivo. Furthermore, signaling from EphB6 promotes the proliferation of surrounding lung parenchymal cells in vivo. Our data provide evidence that EphB6 is a key factor in the crosstalk between disseminated dormant cancer cells and the lung parenchyma and that the TFEB-lysosomal pathway plays an important role in the persistence of DDCCs.

Keywords: EphB6; Ephrin receptors; breast cancer; dormancy; lysosomes; metastasis; tumor microenvironment.


Conflict of interest statement

The authors declare no conflict of interest.

Figures

Figure 1
Figure 1
EphB6 supports the survival of disseminated dormant breast cancer cells. (A) RT-qPCR analysis of representative genes of the dormancy response. D2.0R-EGFP cells have been cultured alone, cocultured with AT1-like cells (Contact), or with conditioned medium from AT1-like cells (CM). Mean normalized pooled samples from n = 3 independent experiments. 2 way ANOVA, multiple comparisons. Error bars: SD. (B) Workflow of the loss-of-function screen in vivo for survival genes in disseminated dormant cancer cells (DDCCs) [8]. (C) Representation scores for each gene included in the screen, calculated from the fold change of representation of each shRNA relative to pre-injection abundance. On the light blue side, there are genes whose downregulation leads to a reduced representation of the clones. Black dots indicate genes (ranking among the top 10 genes) with a consistent effect of at least 2 out of 3 shRNAs included in the screening. (D) D2.0R-EGFP cells stably expressing the indicated shRNA were injected intravenously together with an equal amount of D2.0R-mCherry-shCtrl cells as an internal control. After 3 weeks the amount of surviving D2.0R cells was measured and the ratio EGFP/mCherry calculated. n = 5 mice for shCtrl cells, n = 4 mice for each shEphB6 sequence. One-way ANOVA test. Mean with SD. (E) qPCR analysis of Ephb6 mRNA in D2.0R-EGFP cells stably expressing shRNA. One-way ANOVA test. Mean with SD.
Figure 2
Figure 2
EphB6 expression is triggered by lung and soft microenvironments. (A) Transcriptome analysis (RNA sequencing) of D2.0R-EGFP cells upon dissemination in the lung Vs D2.0R-EGFP in monoculture. DOWN-regulated (Log2 fold-change < −1 and adjusted p-value < 0.01) and UP-regulated (Log2 fold-change > 1 and adjusted p-value < 0.01) genes are indicated in blue and red respectively. (B) qPCR of EphB6 gene in D2.0R-EGFP cells upon dissemination in the lung (n = 3 mice) or after monoculture (n = 3 samples). Unpaired t-test. Mean with SD. (C) Relative expression of Ephb6 gene in D2.0R-EGFP cells cultivated on coated plastic or on Matrigel. n = 3 independent experiments, ratio paired two-tailed t-test, mean with SEM. (D) Relative expression of Ephb6 gene in D2.0R-EGFP cells cultivated on synthetic hydrogels with indicated stiffness. n = 7 samples merged from n = 3 independent experiments, unpaired two-tailed t-test. (E) EPHB6 expression in ER+ primary breast cancers and metastases from publicly available databases (details in Material and Methods). Q-value after unpaired Significance Analysis of Microarray. (F) Kaplan-Meier curves showing Distant Metastasis-Free Survival of indicated breast cancer patients with indicated cancer subtypes derived from the database at https://kmplot.com/analysis/ (2 February 2021), stratified according to genes repressed by EphB6. The black line indicates patients with lower expression of those genes, i.e., with higher EphB6 activity, that is correlated to an increased likelihood of distant relapses.
Figure 3
Figure 3
EphB6 regulates the crosstalk with lung epithelial cells. (A) Balloon plot summarizing GSEA results of AT1-like cells in monoculture and cocultured with D2.0R-EGFP-shCtrl cells or shEphB6 cells (results from two independent shEphB6 sequences, #31 and #35). Balloon size represents the statistical significance (−log10 FDR), while color indicates the fold-enrichment for each term (NES). Complete the list of gene sets in Figure S1. (B) Representative images of Ki67+ lung resident cells surrounding GFP+ disseminated indolent breast cancer cells with control shRNA or shRNAs targeting EphB6. Scale bar, 10 μm. (C) Quantification of images in B. Percentage of D2.0R-EGFP cells in contact with the indicated number of Ki67+ lung cells. n = 191, 143 and 177 cells for shCtrl, shEphB6#31 and shEphB6#35, respectively, across 3 mice/sample. P-value of the percentage of D2.0R-EGFP cells contacting 3 Ki67+ lung cells. 2 way ANOVA, multiple comparisons.
Figure 4
Figure 4
Transcriptomic analysis of DDCCs depleted cells in vivo and in coculture. (A) Dot plot shows the correlation of NES values generated from GSEA between four indicated comparisons, where the color represents the Spearman correlation and size presents the −log10(p-value) of the correlation. (B) Balloon plot summarizing GSEA results of the indicated comparisons for each indicated gene sets. The plot was manually curated to help visualize and show gene sets with higher coherent enrichment in the different conditions. Balloon size represents the statistical significance (−log10 FDR), while color indicates the fold-enrichment for each term. Complete list of gene sets in Figure S2. (C) Profile of the running ES score for gene sets including TFEB direct lysosomal targets after GSEA of D2.0R-EGFP cells with shCtrl or shEphB6 either disseminated in vivo or in coculture with AT1-like cells.
Figure 5
Figure 5
EphB6 regulates the TFEB-lysosomal axis. (A) Relative induction (coculture with AT1-like cells Vs monoculture) of transfected TFEB-luciferase reporter in D2.0R-EGFP cells stably expressing the indicated shRNAs. n = 5 (shCtrl and shEphB6#31) or 4 (shEphB6#35) independent experiments. One-way ANOVA multiple comparisons test. Mean with SEM. (B) Relative mouse Tfeb mRNA levels in monocultured or cocultured shControl- or shEphB6-D2.0R-EGFP cells. Mean normalized values from n = 3 independent experiments. One-way ANOVA. Mean with SD. (C) Relative percentage of the cytoplasm with positive Lysotracker signal in D2.0R-EGFP cells with indicated shRNAs upon coculture with AT1-like cells, or in monoculture. Mean normalized from n = 3 independent experiments. Kruskal-Wallis multiple comparisons test. Same results with MCF7-EGFP cells in Figure S3B. (D) Representative images of lysosomal membrane protein LAMP2 in control D2.0R-EGFP cells or cells with EphB6 knockdown after dissemination to lung parenchyma quantified in (E). Scale bar, 5 μm. (E) Relative mean intensity of LAMP2 in lung disseminated shCtrl-, or shEphB6-D2.0R-EGFP cells. Three mice/sample. Kruskal-Wallis multiple comparisons test. (F) Variation of D2.0R-EGFP cell number after inhibition of lysosomal acidification inhibition with Bafilomycin A1 treatment. Mean normalized samples from n = 3 independent experiments. Kruskal-Wallis test. Mean with SD. (G) Variation of cell number of D2.0R-EGFP and MCF7-EGFP upon shEphB6 knock-down in coculture with AT1-like cells. Mean normalized pooled samples from n = 3 independent experiments. One-way ANOVA. Mean with SD. (H) Relative number of cocultured cells, shControl or shEphB6#31-D2.0R-EGFP, stably expressing hTFEB wild-type (left) or hTFEB-S142/211A (right). Mean normalized samples from n = 2 independent experiments. Two-way ANOVA, multiple comparisons. (I) Relative percentage of the cytoplasm with positive Lysotracker signal in D2.0R-EGFP cells with indicated shRNAs upon coculture with AT1-like cells, treated or not with 0.5 µM CHIR99021 for 48 h. Mean normalized from n = 3–4 independent experiments. Kruskal-Wallis multiple comparisons test. (J) Relative number of cocultured cells, shControl or shEphB6#31-D2.0R-EGFP, treated or not with CHIR99021 for 5 days. Mean normalized samples from n = 3 independent experiments. Two-way ANOVA, multiple comparisons.

References

    1. Zhang X.H.-F., Giuliano M., Trivedi M.V., Schiff R., Osborne C.K. Metastasis Dormancy in Estrogen Receptor—Positive Breast Cancer. Clin. Cancer Res. 2013;19:6389–6397. doi: 10.1158/1078-0432.CCR-13-0838. - DOI - PMC - PubMed
    1. Pantel K., Hayes D.F. Disseminated Breast Tumour Cells: Biological and Clinical Meaning. Nat. Rev. Clin. Oncol. 2018;15:129–131. doi: 10.1038/nrclinonc.2017.174. - DOI - PubMed
    1. Gawrzak S., Rinaldi L., Gregorio S., Arenas E.J., Salvador F., Urosevic J., Figueras-Puig C., Rojo F., Del Barco Barrantes I., Cejalvo J.M., et al. MSK1 Regulates Luminal Cell Differentiation and Metastatic Dormancy in ER + Breast Cancer. Nat. Cell Biol. 2018;20:211–221. doi: 10.1038/s41556-017-0021-z. - DOI - PubMed
    1. Pavlovic M., Arnal-Estapé A., Rojo F., Bellmunt A., Tarragona M., Guiu M., Planet E., Garcia-Albéniz X., Morales M., Urosevic J., et al. Enhanced MAF Oncogene Expression and Breast Cancer Bone Metastasis. J. Natl. Cancer Inst. 2015:107. doi: 10.1093/jnci/djv256. - DOI - PMC - PubMed
    1. Aguirre-Ghiso J.A., Sosa M.S. Emerging Topics on Disseminated Cancer Cell Dormancy and the Paradigm of Metastasis. Annual Rev. Cancer Biol. 2018;2:377–393. doi: 10.1146/annurev-cancerbio-030617-050446. - DOI