

Lab-Scale Study of Temperature and Duration Effects on Carbonized Solid Fuels Properties Produced from Municipal Solid Waste Components
- PMID: 33802515
- PMCID: PMC7959479
- DOI: 10.3390/ma14051191
Lab-Scale Study of Temperature and Duration Effects on Carbonized Solid Fuels Properties Produced from Municipal Solid Waste Components
Abstract
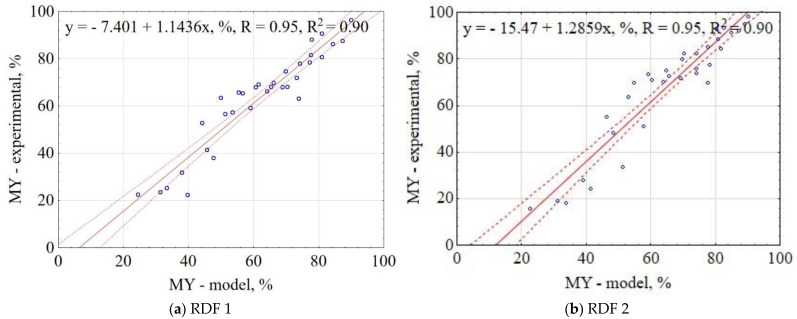
In work, data from carbonization of the eight main municipal solid waste components (carton, fabric, kitchen waste, paper, plastic, rubber, paper/aluminum/polyethylene (PAP/AL/PE) composite packaging pack, wood) carbonized at 300-500 °C for 20-60 min were used to build regression models to predict the biochar properties (proximate and ultimate analysis) for particular components. These models were then combined in general models that predict the properties of char made from mixed waste components depending on pyrolysis temperature, residence time, and share of municipal solid waste components. Next, the general models were compared with experimental data (two mixtures made from the above-mentioned components carbonized at the same conditions). The comparison showed that most of the proposed general models had a determination coefficient (R2) over 0.6, and the best prediction was found for the prediction of biochar mass yield (R2 = 0.9). All models were implemented into a spreadsheet to provide a simple tool to determine the potential of carbonization of municipal solid waste/refuse solid fuel based on a local mix of major components.
Keywords: CO2-assisted pyrolysis; circular economy; municipal waste; organic waste; regression models; thermal treatment; waste conversion; waste recycling; waste to carbon; waste to energy.
Conflict of interest statement
The authors declare no conflict of interest and declare that the funders had no role in the design of the study; in the collection, analyses, or interpretation of data; in the writing of the manuscript, or in the decision to publish the results.
Figures


References
-
- Mavropoulos A. Waste Management 2030+ [(accessed on 13 December 2020)]; Available online: https://waste-management-world.com/a/waste-management.
-
- Kaczor Z., Buliński Z., Werle S. Modelling approaches to waste biomass pyrolysis: A review. Renew. Energy. 2020;159:427–443. doi: 10.1016/j.renene.2020.05.110. - DOI
-
- Stępień P., Pulka J., Serowik M., Białowiec A. Thermogravimetric and calorimetric characteristics of alternative fuel in terms of its use in low-temperature pyrolysis. Waste Biomass Valori. 2019;10:1669–1677. doi: 10.1007/s12649-017-0169-6. - DOI
Grants and funding
LinkOut - more resources
Full Text Sources
Other Literature Sources
Research Materials
Miscellaneous
