. 2021 Mar 3;10(3):379.
doi: 10.3390/antiox10030379.

Disruption of Endoplasmic Reticulum and ROS Production in Human Ovarian Cancer by Campesterol

Affiliations

Disruption of Endoplasmic Reticulum and ROS Production in Human Ovarian Cancer by Campesterol

Hyocheol Bae et al. Antioxidants (Basel). .

Abstract

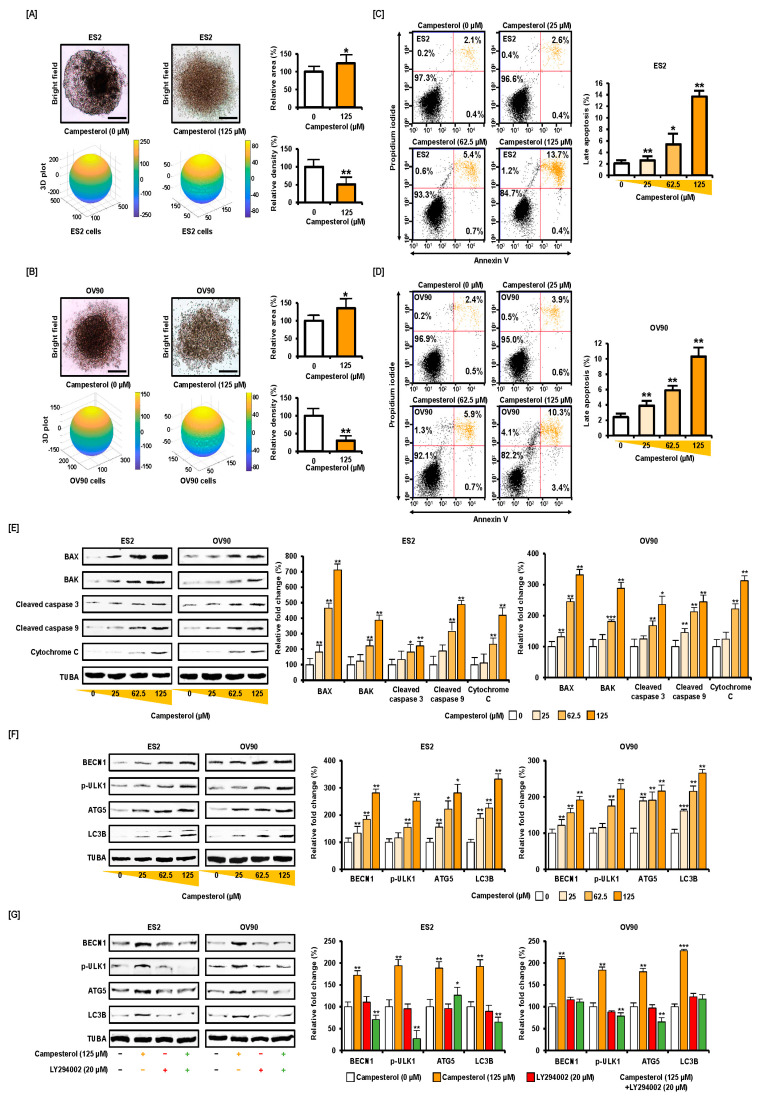
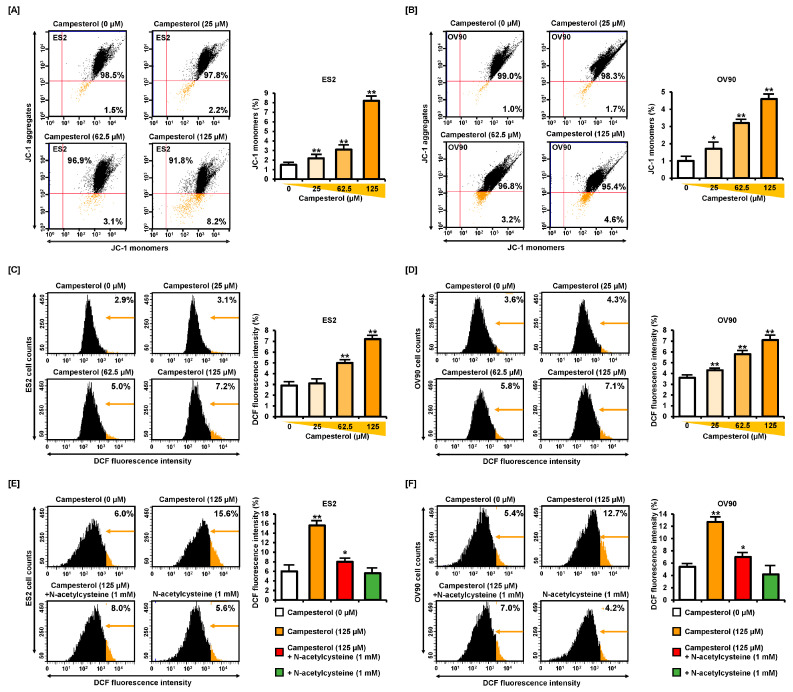
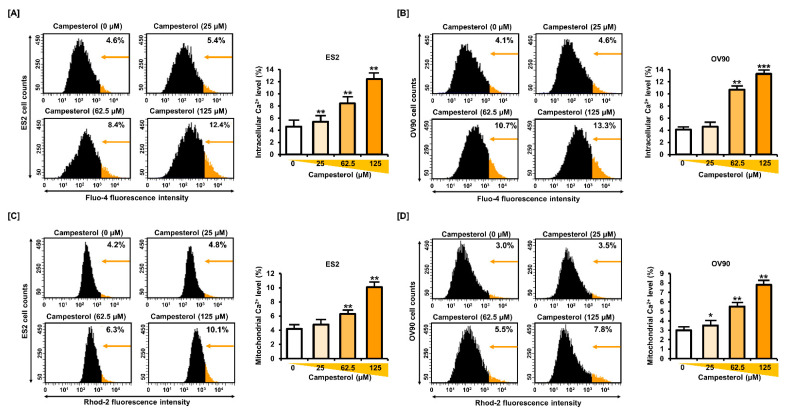
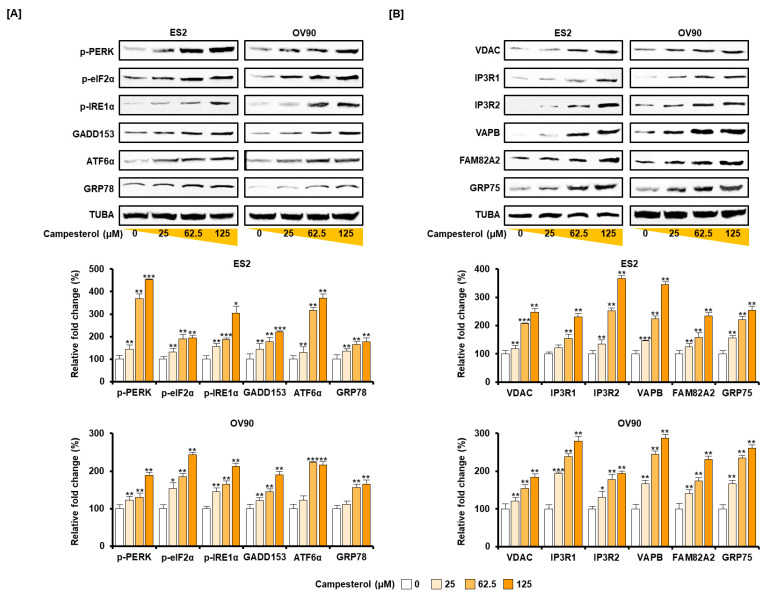
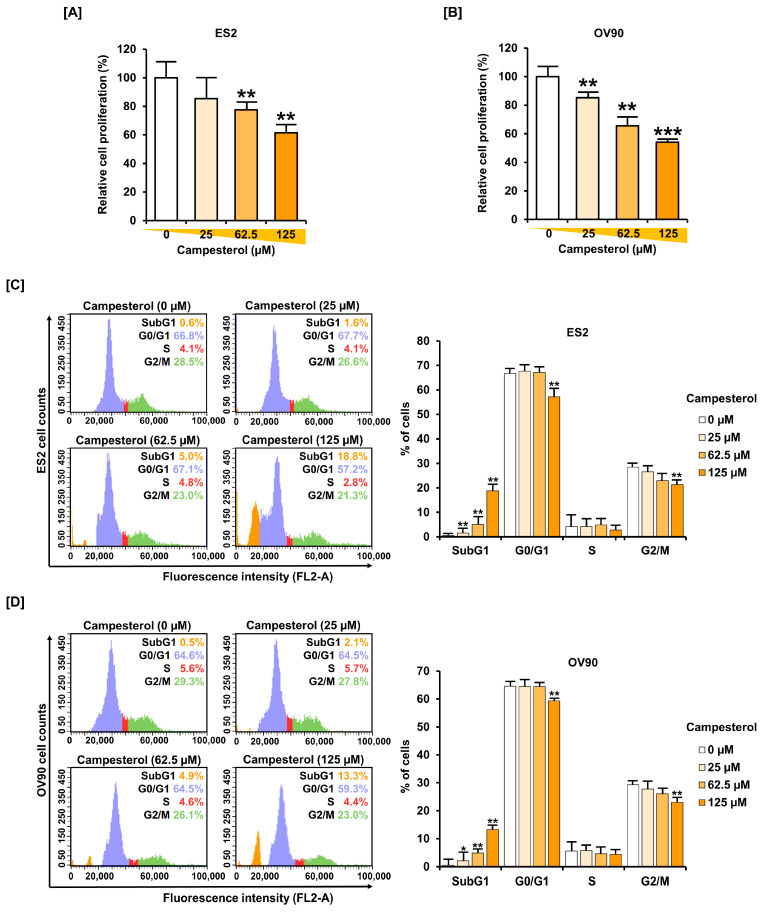
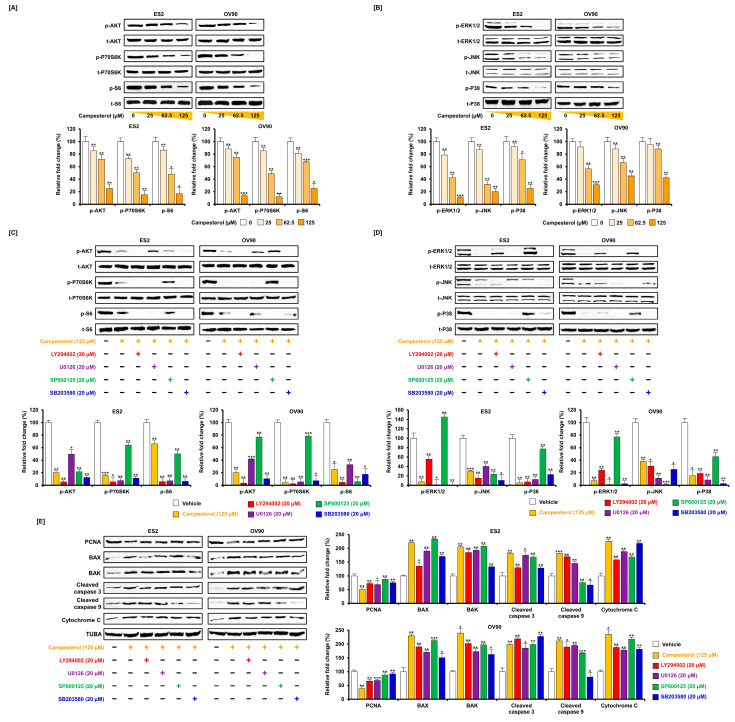
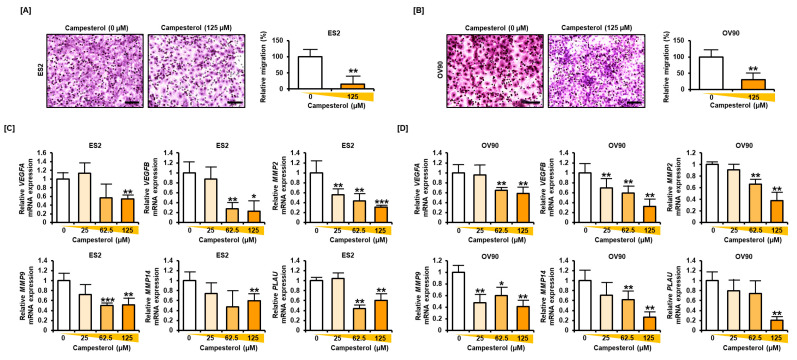
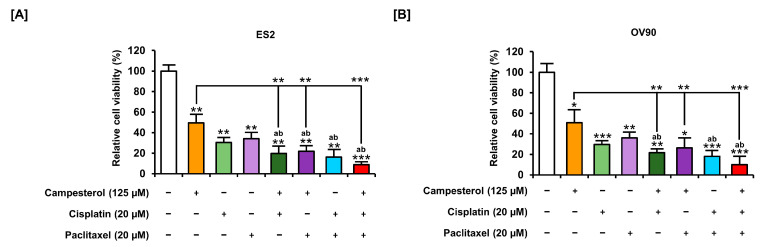
Phytosterols, which are present in a variety of foods, exhibit various physiological functions and do not have any side effects. Here, we attempted to identify functional role of campesterol in regulation of oxidative stress by leading to cell death of ovarian cancer. We investigated the effects of campesterol on cancer cell aggregation using a three-dimensional (3D) culture of human ovarian cancer cells. The effects of campesterol on apoptosis, protein expression, proliferation, the cell cycle, and the migration of these cells were determined to unravel the underlying mechanism. We also investigated whether campesterol regulates mitochondrial function, the generation of reactive oxygen species (ROS), and calcium concentrations. Our results show that campesterol activates cell death signals and cell death in human ovarian cancer cells. Excessive calcium levels and ROS production were induced by campesterol in the two selected ovarian cancer cell lines. Moreover, campesterol suppressed cell proliferation, cell cycle progression, and cell aggregation in ovarian cancer cells. Campesterol also enhanced the anticancer effects of conventional anticancer agents. The present study shows that campesterol can be used as a novel anticancer drug for human ovarian cancer.

Keywords: ROS; campesterol; cell death; mitochondria dysfunction; ovarian cancer.


Conflict of interest statement

The authors declare no conflict of interest.

Figures

Figure 1
Figure 1
Inhibition of cancer cell aggregation and activation of cell death by campesterol in human ovarian cancer cell lines. (A,B) Comparison of aggregation in the control and campesterol-treated cells. (C,D) A cell apoptosis assay was conducted to investigate the induction of apoptosis in the cells treated with campesterol. The quadrants in the dot plot show the cells in the different phases of apoptosis. The graph shows the changes in the percentages of cells in the late apoptosis phase. (E,F) Western blot analysis showing the activation of the proapoptotic proteins and autophagy proteins upon treatment with campesterol (0, 25, 62.5, and 125 µM). (G) Western blot analysis of proteins from ES2 and OV90 cells treated with Campesterol, LY294002, or co-treated with both. The data represent three independent experiments. The asterisks indicate significant differences between the treated cells and control cells (*** p < 0.001, ** p < 0.01, and * p < 0.05).
Figure 2
Figure 2
Alterations in the MMP and production of ROS by campesterol. (A,B) MMP was determined after treatment with campesterol (0, 25, 62.5, and 125 µM) using JC-1 staining. The graph shows the loss of MMP compared with that in the control. (C,D) The changes in the levels of ROS caused by treatment with campesterol were determined using the DCF dye. The histogram shows the ROS production in comparison with that in the control. (E,F) N-acetylcysteine alleviated ROS production after cotreatment with campesterol and N-acetylcysteine. DCF: dichlorofluorescein. The data represent three independent experiments. The asterisks indicate significant differences between the treated cells and control cells (** p < 0.01, and * p < 0.05)
Figure 3
Figure 3
Concentrations of calcium in the cytosol and mitochondria of cells treated with campesterol. (A,B) Cytosolic levels of calcium were determined using fluo-4 fluorescence. The histogram represents the alterations in the intracellular calcium levels upon treatment of the cells with campesterol (0, 25, 62.5, and 125 µM). The graphs show the changes in the intracellular calcium levels upon treatment of the cells with campesterol compared to that in the control. (C,D) Rhod-2 fluorescence was measured to determine the changes in the concentrations of calcium in the mitochondria. The histogram represents the changes in the mitochondrial calcium concentrations upon treatment of the cells with campesterol. The graphs show the alterations in the concentrations of calcium in the mitochondria upon treatment of the cells with campesterol compared with that in the control. The data represent three independent experiments. The asterisks indicate significant differences between the treated cells and control cells (*** p < 0.001, ** p < 0.01, and * p < 0.05).
Figure 4
Figure 4
Activation of the ER-stress sensor and the ER–mitochondrial axis signals by campesterol in the ovarian cancer cells. (A) Western blot analysis of ER-stress proteins in the cells treated with campesterol (0, 25, 62.5, and 125 µM). (B) Western blot analysis of the ER–mitochondrial axis proteins in the cells treated with campesterol (0, 25, 62.5, and 125 µM). TUBA was used as a control. The graph represents the relative fold changes in the levels of proteins induced by campesterol treatment compared with that in the control (100%). The data represent three independent experiments. The asterisks indicate significant differences between the treated cells and control cells (*** p < 0.001, ** p < 0.01, and * p < 0.05).
Figure 5
Figure 5
Inhibition of cell growth by campesterol in the ovarian cancer cell lines. (A,B) The cell proliferation assay in the campesterol (0, 25, 62.5, and 125 µM)-treated cells. The graphs show the percentage of cell growth compared with that of the control cells (100%). (C,D) The histogram presents the cell cycle of the campesterol (0, 25, 62.5, and 125 µM)-treated cells. The graphs represent the percentages of the campesterol (0, 25, 62.5, and 125 µM)-treated cells in the sub-G1, G0/G1, S, and G2/M phases. The data represent three independent experiments. The asterisks indicate significant differences between the treated cells and control cells (*** p < 0.001, ** p < 0.01, and * p < 0.05).
Figure 6
Figure 6
Changes in the cell growth-related and proapoptotic signals upon treatment of the cells with campesterol. (A,B) Western blots showing the changes in the PI3K/MAPK signals upon campesterol treatment in both cell lines. (C,D) Western blots showing the alterations in the PI3K/MAPK signals upon cotreatment of LY294002, U0126, SP600125 and SB203580 with campesterol in both cell lines. (E) Representative western blots of the levels of the proliferating and proapoptotic factors upon cotreatment with campesterol and LY294002, U0126, SP600125, or SB203580 in both cell lines. The data represent three independent experiments. The asterisks indicate significant differences between the treated cells and control cells (*** p < 0.001, ** p < 0.01, and * p < 0.05).
Figure 7
Figure 7
Campesterol inhibits cell migration and angiogenic gene expression. (A,B) The migration of cells was investigated using Transwell inserts. For each cell line, five non-overlapping locations were visualized. (C,D) The expression of genes involved in angiogenesis was determined by quantitative RT-PCR. Scale bar represents 100 μm. The data represent three independent experiments. The asterisks indicate significant differences between the treated cells and control cells (*** p < 0.001, ** p < 0.01, and * p < 0.05).
Figure 8
Figure 8
Reduced cell proliferation upon cotreatment with campesterol and existing drugs in ovarian cancer cell lines. (A,B) The proliferation of cells treated with campesterol and existing drugs was determined in relation to that of the control cells (100%). Statistical significance was also shown between the group treated with campesterol alone and the group treated with the conventional drug plus campesterol. The data represent three independent experiments. The asterisks indicate significant differences between the treated cells and control cells (*** p < 0.001, ** p < 0.01, and * p < 0.05). ‘a’ and ‘b’ indicate significant differences as compared to cisplatin and paclitaxel, respectively.

Similar articles

Cited by

References

    1. Genser B., Silbernagel G., De Backer G., Bruckert E., Carmena R., Chapman M.J., Deanfield J., Descamps O.S., Rietzschel E.R., Dias K.C., et al. Plant sterols and cardiovascular disease: A systematic review and meta-analysis†. Eur. Hear. J. 2012;33:444–451. doi: 10.1093/eurheartj/ehr441. - DOI - PMC - PubMed
    1. Lea L., Hepburn P. Safety evaluation of phytosterol-esters. Part 9: Results of a European post-launch monitoring programme. Food Chem. Toxicol. 2006;44:1213–1222. doi: 10.1016/j.fct.2006.01.017. - DOI - PubMed
    1. Lindsey K., Pullen M.L., Topping J.F. Importance of plant sterols in pattern formation and hormone signalling. Trends Plant. Sci. 2003;8:521–525. doi: 10.1016/j.tplants.2003.09.012. - DOI - PubMed
    1. Benveniste P. Biosynthesis and Accumulation of Sterols. Annu. Rev. Plant. Biol. 2004;55:429–457. doi: 10.1146/annurev.arplant.55.031903.141616. - DOI - PubMed
    1. Wang Z.-Y., Wang Q., Chong K., Wang F., Wang L., Bai M., Jia C. The brassinosteroid signal transduction pathway. Cell Res. 2006;16:427–434. doi: 10.1038/sj.cr.7310054. - DOI - PMC - PubMed

LinkOut - more resources