. 2021 Mar 17;4(1):21.
doi: 10.3390/mps4010021.

A Streamlined Approach to Pathway Analysis from RNA-Sequencing Data

Affiliations

A Streamlined Approach to Pathway Analysis from RNA-Sequencing Data

Austin Bow. Methods Protoc. .

Abstract

The reduction in costs associated with performing RNA-sequencing has driven an increase in the application of this analytical technique; however, restrictive factors associated with this tool have now shifted from budgetary constraints to time required for data processing. The sheer scale of the raw data produced can present a formidable challenge for researchers aiming to glean vital information about samples. Though many of the companies that perform RNA-sequencing provide a basic report for the submitted samples, this may not adequately capture particular pathways of interest for sample comparisons. To further assess these data, it can therefore be necessary to utilize various enrichment and mapping software platforms to highlight specific relations. With the wide array of these software platforms available, this can also present a daunting task. The methodology described herein aims to enable researchers new to handling RNA-sequencing data with a streamlined approach to pathway analysis. Additionally, the implemented software platforms are readily available and free to utilize, making this approach viable, even for restrictive budgets. The resulting tables and nodal networks will provide valuable insight into samples and can be used to generate high-quality graphics for publications and presentations.

Keywords: RNA-sequencing; cytoscape; data processing; database; enrichment analysis; mapping; network; protocol; transcriptomics.


Conflict of interest statement

The author declares no conflict of interest.

Figures

Figure 4
Figure 4
CPDB gene set analysis over-representation page and resulting output data table for gene list. Data provided in the output table (from left to right) are pathway name, total number of genes in pathway, the number of input genes in pathway, p-value associated with number of input genes involved in pathway, corrected significance value that accounts for false discovery rate, and the source database for the pathway. The left-most column of check boxes can be selected to determine which pathways will be visualized in the generated network graphic.
Figure 5
Figure 5
Example of CPDB generated network graphic based on manually selected pathways of interest. Nodes can be organized to most effectively display pathway interconnectivity data. Furthermore, “filter edges” options allow for restricting pathway connections.
Figure 1
Figure 1
IMPaLA home page and resulting output data table for gene list. Data provided in the output table (from left to right) are pathway name, the source database for the pathway, the number of input genes in pathway, IDs for input genes involved in pathway, total number of genes in pathway, p-value associated with number of input genes involved in pathway, and corrected significance value that accounts for false discovery rate.
Figure 2
Figure 2
KOBAS data output. Original text file ouput from KOBAS and imported text into spreadsheet for editable file. Provided information (from left to right) are name of pathway/GO, source database for pathway/GO, ID for pathway/GO, number of input genes involved in pathway/GO, number of total genes in pathway/GO, p-value associated with pathway/GO, corrected significance value accounting for false discovery rate, IDs of input genes involved in pathway/GO, and hyperlink to source database file for pathway/GO.
Figure 3
Figure 3
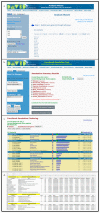
DAVID gene set analysis page (a), resulting data overview page (b), functional annotation cluster results (c), and output text file imported to spreadsheet (d). Data provided in the output table indicates enrichment value associated with the annotated cluster, with each cluster detailing a set of biological functions and corresponding significance values.
Figure 6
Figure 6
Procedural steps for generating basal network from BioGrid database homo sapiens data set.
Figure 7
Figure 7
Workflow overview of pathway analysis protocol for RNA-seq data. Input data of normalized differentially expressed genes lists for samples (Top) is subjected to Data Processing and Pathway Analysis steps to generate both ranked lists and nodal network maps of biological functions and pathways of interest (Bottom).
Figure 8
Figure 8
Example of Ranked PoI spreadsheet displaying (From Left to Right) PoI name, enrichment tools used for detection, and a list of genes involved in the pathway/biological function for each rank set.
Figure 9
Figure 9
Annotated network with integration of STRING application intended to show general gene numbers detected within associated pathways and interconnective elements between pathways.
Figure 10
Figure 10
Annotated network data set with pathway associated genes organized within propellor plot diagram for demonstrating expression changes and significance of target genes in multiple experimental groups as compared to a common control.

References

    1. Kornobis E., Cabellos L., Aguilar F., Frías-López C., Rozas J., Marco J., Zardoya R. TRUFA: A User-Friendly Web Server for de novo RNA-seq Analysis Using Cluster Computing. Evol. Bioinform. 2015;11:EBO.S23873. doi: 10.4137/EBO.S23873. - DOI - PMC - PubMed
    1. Afgan E., Baker D., Batut B., van den Beek M., Bouvier D., Čech M., Chilton J., Clements D., Coraor N., Gruning B.A., et al. The Galaxy platform for accessible, reproducible and collaborative biomedical analyses: 2018 update. Nucleic Acids Res. 2018;46:W537–W544. doi: 10.1093/nar/gky379. - DOI - PMC - PubMed
    1. Torson A.S., Dong Y.-W., Sinclair B.J. Help, there are ‘omics’ in my comparative physiology! J. Exp. Biol. 2020;223:191262. - PubMed
    1. Chen L., Fei C., Zhu L., Xu Z., Zou W., Yang T., Lin H., Xi D. RNA-seq approach to analysis of gene expression profiles in dark green islands and light green tissues of Cucumber mosaic virus-infected Nicotiana tabacum. PLoS ONE. 2017;12:e0175391. doi: 10.1371/journal.pone.0175391. - DOI - PMC - PubMed
    1. Warden C.D., Yuan Y.-C., Wu X. Optimal calculation of RNA-Seq fold-change values. Int. J. Comput. Bioinform. Silico Model. 2013;2:285–292.

LinkOut - more resources