. 2021 Mar 9;22(5):2743.
doi: 10.3390/ijms22052743.

Methamphetamine Blocks Adenosine A2A Receptor Activation via Sigma 1 and Cannabinoid CB1 Receptors

Affiliations

Methamphetamine Blocks Adenosine A2A Receptor Activation via Sigma 1 and Cannabinoid CB1 Receptors

Mireia Casanovas et al. Int J Mol Sci. .

Abstract

Methamphetamine is, worldwide, one of the most consumed drugs of abuse. One important side effect is neurodegeneration leading to a decrease in life expectancy. The aim of this paper was to check whether the drug affects one of the receptors involved in neurodegeneration/neuroprotection events, namely the adenosine A2A receptor (A2AR). First, we noticed that methamphetamine does not affect A2A functionality if the receptor is expressed in a heterologous system. However, A2AR becomes sensitive to the drug upon complexes formation with the cannabinoid CB1 receptor (CB1R) and the sigma 1 receptor (σ1R). Signaling via both adenosine A2AR and cannabinoid CB1R was affected by methamphetamine in cells co-expressing the two receptors. In striatal primary cultures, the A2AR-CB1R heteromer complex was detected and methamphetamine not only altered its expression but completely blocked the A2AR- and the CB1R-mediated activation of the mitogen activated protein kinase (MAPK) pathway. In conclusion, methamphetamine, with the participation of σ1R, alters the expression and function of two interacting receptors, A2AR, which is a therapeutic target for neuroprotection, and CB1R, which is the most abundant G protein-coupled receptor (GPCR) in the brain.

Keywords: G protein-coupled receptor GPCR; drug of abuse; heteromer; neuroprotection; striatal neurons.


Conflict of interest statement

The authors declare no conflict of interest. The funders had no role in the design of the study; in the collection, analyses, or interpretation of data; in the writing of the manuscript, or in the decision to publish the results.

Figures

Figure 1
Figure 1
The effect of methamphetamine on A2AR–CB1R colocalization and receptor–receptor interaction. Confocal microscopy images were obtained in HEK-293T cells transfected with 0.5 μg cDNA coding for CB1R-YFP (A,D), with 0.5 μg cDNA for A2AR-Rluc (B,E) or with 0.5 μg cDNA for both CB1R-YFP and A2AR-Rluc (C,F). Cells were treated with 1 μM methamphetamine (DF) or vehicle (AC) for 1 h. Receptors fused to Rluc (red) were identified by immunocytochemistry and receptors fused to YFP (green) were identified by their own fluorescence. Colocalization is shown in yellow. Nuclei were stained with Hoechst (blue). Images are taken near the surface of the slide to observe a higher portion of the plasma membrane. Scale bars: 20 μm. (G): Bioluminescence Resonance Energy Transfer (BRET) assays were performed in HEK-293T cells transfected with a constant amount of the cDNA coding for A2AR fused to Rluc (1 μg) or the cDNA coding for D1R fused to Rluc (0.5 μg to 4.5 μg) (red line) and increasing amounts of the cDNA coding for CB1R fused to YFP (0.5 μg to 4.5 μg). Transfected cells were treated (green dots) or not (blue dots) with 1 μM methamphetamine. BRET is expressed as milli BRET units (mBU) and is given as the mean ± SEM of 8 different experiments grouped by amount of BRET acceptor.
Figure 2
Figure 2
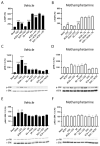
Methamphetamine effect on A2A–CB1Het functionality: cAMP and ERK/Akt phosphorylation. HEK-293T cells co-transfected with cDNAs for A2AR (0.5 µg) and for CB1R (0.6 µg) were treated (30 min) with vehicle (A,C,E) or 1 µM methamphetamine (B,D,F) and subsequently treated with 500 nM of the A2AR antagonist SCH 58261 (SCH) or with 500 nM of the CB1R antagonist SR 141716A (SR). Receptors were activated using 100 nM of the A2AR agonist CGS 21680 (CGS), with 200 nM of the CB1R agonist, ACEA or both, before adding 0.5 µM forskolin (FK) or vehicle. The cytosolic cAMP levels (A,B) and the extracellular signal-regulated (ERK) 1/2 (C,D) or Akt (E,F) phosphorylation signals were determined. Results are expressed as percentage over basal and are the mean ± SEM of six experiments performed in triplicates. A one-way ANOVA followed by Bonferroni multiple comparison post hoc test showed a significant effect (* p < 0.05, ** p < 0.01, *** p < 0.001 vs. basal condition; ### p < 0.001 vs. FK condition). In (CF) a representative Western blot is shown (bottom). p-ERK indicates phosphorylated ERKs, t-ERK indicates total ERKs, p-AKT indicates phosphorylated AKTs.
Figure 3
Figure 3
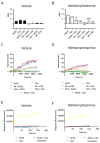
Methamphetamine effect on A2A–CB1Het functionality: ß-arrestin-2 recruitment, dynamic mass redistribution (DMR) and Ca2+ mobilization. HEK-293T cells transfected with cDNAs corresponding to A2AR-YFP (0.4 µg), CB1R (0.3 µg) and ß-arrestin-2-Rluc (0.5 µg) (A,B) or with A2AR (0.5 µg), CB1R (0.6 µg) (C,D) and 6GCaMP calcium sensor (1.5 µg) (E,F) were treated (30 min) with vehicle (A,C,E) or with 1 µM methamphetamine (B,D,F) and subsequently treated with 500 nM of the A2AR antagonist SCH 58261 (SCH) or with 500 nM of the CB1R antagonist SR 141716A (SR). Receptors were activated using 100 nM of the A2AR agonist CGS 21680 (CGS), with 200 nM of the CB1R agonist ACEA or both. In (E,F), a portion of the cells were stimulated with 1 µM ionomycin as a positive control. The BRET data resulting from ß-arrestin-2 recruitment (A,B), time-dependent DMR representative traces (C,D) and time-dependent representative traces of cytoplasmic Ca2+ levels (E,F) are shown. In (A,B), BRET is expressed as milli BRET units (mBU) and is given as the mean ± SEM of six different experiments grouped by amount of BRET acceptor. A one-way ANOVA followed by Bonferroni multiple comparison post hoc test showed a significant effect over 100% (& p < 0.05, &&& p < 0.001 versus ACEA condition; %% p < 0.01 versus CGS condition).
Figure 4
Figure 4
σ1R involvement in methamphetamine effects on A2A and CB1 receptors. HEK-293T cells transfected with cDNAs coding for A2AR (0.5 µg) (A,B) or for CB1R (0.6 µg) (CF) in the absence (AC,E) or presence (D,F) of siRNA for σ1R (3 μg) to silence σ1R were stimulated with 1 µM methamphetamine (Met, white bars) or vehicle (black bars) for 30 min. Cells were treated with 100 nM of the A2AR agonist CGS 21680 (CGS) (A,B) or with 200 nM of the CB1R agonist, ACEA (CF). 0.5 μM of forskolin (FK) was used to determine Gi coupling to the CB1R. Then, cAMP levels (A,C,D) and ERK1/2 phosphorylation (B,E,F) were determined and expressed as percentage over basal or, in the case of cAMP in CB2R-expressing cells, over forskolin treatment. Values are the mean ± SEM (n = 5, in triplicates). One-way ANOVA followed by Bonferroni multiple comparison post hoc test showed a significant effect (* p < 0.05, *** p < 0.001 vs. basal condition, ### p < 0.001 versus FK condition). In (B,E,F), a representative Western blot is shown (bottom). In (G), FRET experiments were performed in HEK-293T cells transfected with 0.25 μg of cDNA for σ1R-YFP and increasing amounts of cDNA for CB1R-RFP (0.2 μg to 2 μg) or for A2AR-RFP (0.1 μg to 1.5 μg). When indicated cells were pretreated with 1 µM methamphetamine. Results were grouped by amount of FRET acceptor. p-ERK indicates phosphorylated ERKs, t-ERK indicates total ERKs.
Figure 5
Figure 5
σ1R involvement in methamphetamine effects on A2A–CB1Hets. HEK-293T cells were co-transfected with cDNAs coding for A2AR (0.5 μg) and for CB1R (0.6 μg) (AF). When indicated, σ1R (B,E) or calneuron-1 (Caln-1) (C,F) were silenced using 3 μg specific siRNA. Cells were pretreated with 1 μM methamphetamine (Met, white bars) or vehicle (black bars) for 30 min. GPCRs were activated either using 100 nM of the A2AR agonist, CGS 21680 in naïve cells (CGS, (AC)) or 200 nM of the CB1R agonist, ACEA, in cells treated with 0.5 μM of forskolin (FK) (DF). Then, cAMP levels (AF) were determined and expressed as a percentage over basal (A2AR) or forskolin (CB1R). Values are the mean ± SEM of five different experiments performed in triplicates. One-way ANOVA followed by Bonferroni multiple comparison post hoc test showed significant effects (* p < 0.05, *** p < 0.001 vs. basal condition or ### p < 0.001 vs. FK condition). In (G), SRET experiments were performed in HEK-293T cells transfected with constant amounts of cDNAs for σ1R-Rluc (0.5 μg) or D1R-Rluc (0.33 μg) and for CB1R-YFP (1 μg) and increasing amounts of cDNA for A2AR-RFP (0.25 μg to 2.5 μg). Results were grouped by amount of SRET acceptor.
Figure 6
Figure 6
Methamphetamine effect on A2A–CB1Het expression and signaling in striatal neurons. (A,B) Proximity ligation assays (PLA) were performed in striatal neurons treated with 1 µM methamphetamine for two hours (acute, green bars), for one week (chronic, red bars) or with vehicle (control, blue bars) using primary antibodies specific for the A2A, σ1 and CB1 receptors. As a negative control (NC), neurons were only treated with the primary antibody against CB1R. See Methods for details on the steps in the PLA procedure. Confocal microscopy images (stacks of 4 consecutives planes) show heteroreceptor complexes as red clusters over Hoechst-stained nuclei (blue). Scale bar 20 µm (A). The bar graph (B) shows the number of red dots/neuron and the number above the bars indicates the percentage of neurons presenting red dots. Values are the mean ± SEM (n = 8–10). A two-way ANOVA followed by Bonferroni’s multiple comparison post hoc test were used for statistical analysis (** p < 0.01, *** p < 0.001). cAMP levels (C) and ERK 1/2 phosphorylation (D) were determined in striatal neurons treated with methamphetamine 1 µM for two hours (acute, green bars) or for one week (chronic, blue bars) or vehicle (control, blue bars). When indicated cells were incubated with 500 nM of the A2AR antagonist SCH 58261 (SCH) or with 500 nM of the CB1R antagonist SR 141716A (SR). Receptors activated using 100 nM of the A2AR agonist CGS 21680 (CGS) or with 200 nM of the CB1R agonist ACEA. Forskolin (FK) was used to determine Gi coupling to the CB1 receptor (C). The values are the mean ± SEM of six experiments performed in triplicates. A two-way ANOVA followed by Bonferroni’s multiple comparison post hoc test were used for statistical analysis (* p < 0.05, ** p < 0.01, *** p < 0.001 versus basal condition; ## p < 0.01 versus FK condition).

Similar articles

Cited by

References

    1. Oñatibia-Astibia A., Franco R., Martínez-Pinilla E. Health benefits of methylxanthines in neurodegenerative diseases. Mol. Nutr. Food Res. 2017;61:1600670. doi: 10.1002/mnfr.201600670. - DOI - PubMed
    1. Franco R., Oñatibia-Astibia A., Martínez-Pinilla E. Health benefits of methylxanthines in cacao and chocolate. Nutrients. 2013;5:4159–4173. doi: 10.3390/nu5104159. - DOI - PMC - PubMed
    1. Eskelinen M.H., Ngandu T., Tuomilehto J., Soininen H., Kivipelto M. Midlife healthy-diet index and late-life dementia and Alzheimer’s disease. Dement. Geriatr. Cogn. Dis. Extra. 2011;1:103–112. doi: 10.1159/000327518. - DOI - PMC - PubMed
    1. Sindi S., Kåreholt I., Eskelinen M., Hooshmand B., Lehtisalo J., Soininen H., Ngandu T., Kivipelto M. Healthy dietary changes in midlife are associated with reduced dementia risk later in life. Nutrients. 2018;10:1649. doi: 10.3390/nu10111649. - DOI - PMC - PubMed
    1. Eskelinen M.H., Ngandu T., Tuomilehto J., Soininen H., Kivipelto M. Midlife coffee and tea drinking and the risk of late-life dementia: A population-based CAIDE study. J. Alzheimer’s Dis. 2009;16:85–91. doi: 10.3233/JAD-2009-0920. - DOI - PubMed

MeSH terms

LinkOut - more resources