. 2021 Mar 9;13(5):1169.
doi: 10.3390/cancers13051169.

Preclinical Safety Evaluation of Intranasally Delivered Human Mesenchymal Stem Cells in Juvenile Mice

Affiliations

Preclinical Safety Evaluation of Intranasally Delivered Human Mesenchymal Stem Cells in Juvenile Mice

Yolanda Aguilera et al. Cancers (Basel). .

Abstract

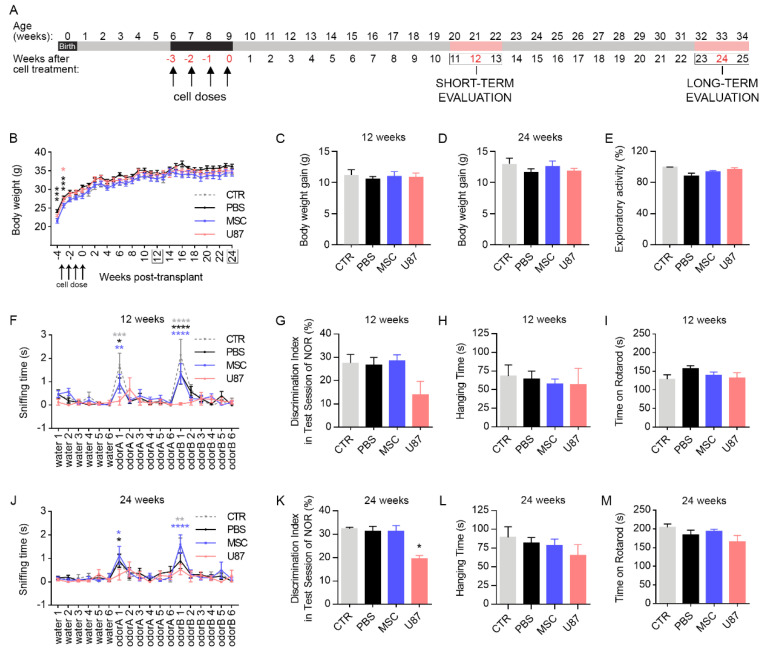
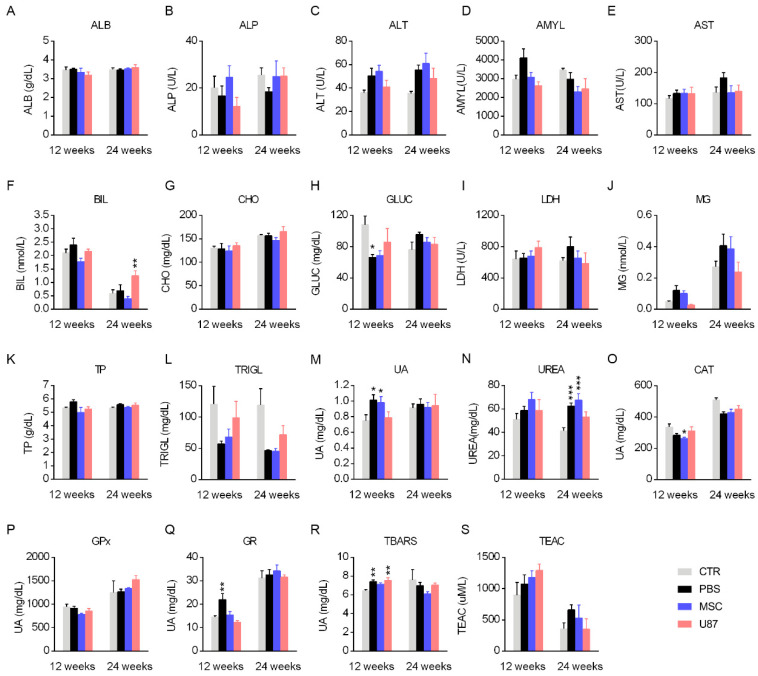
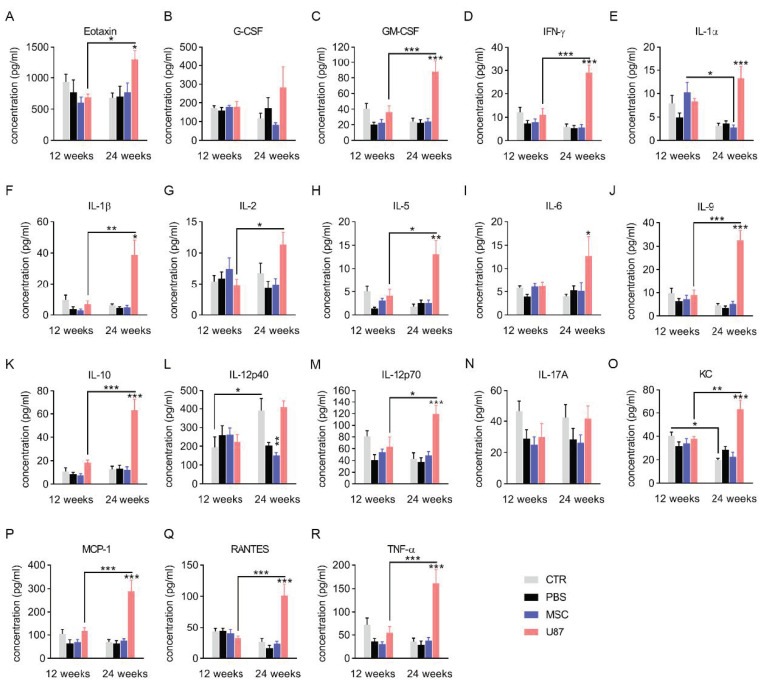
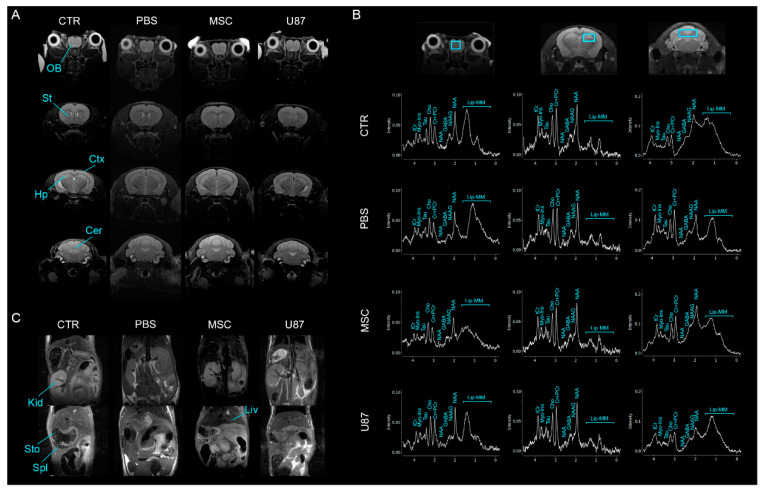
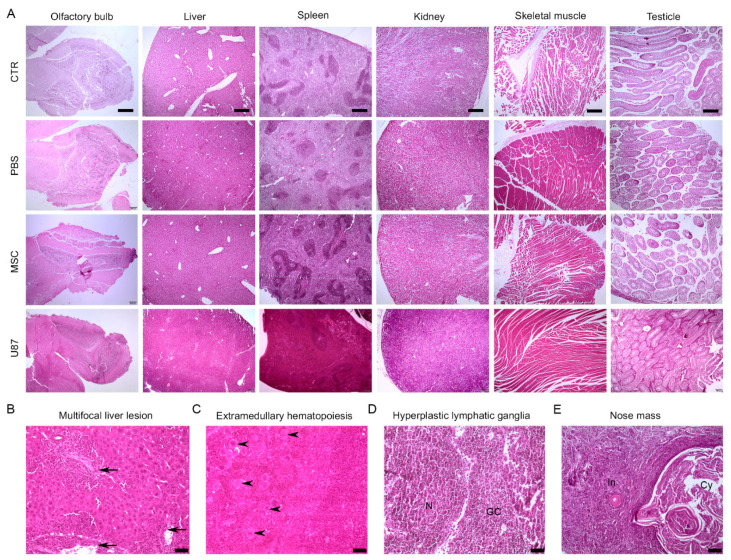
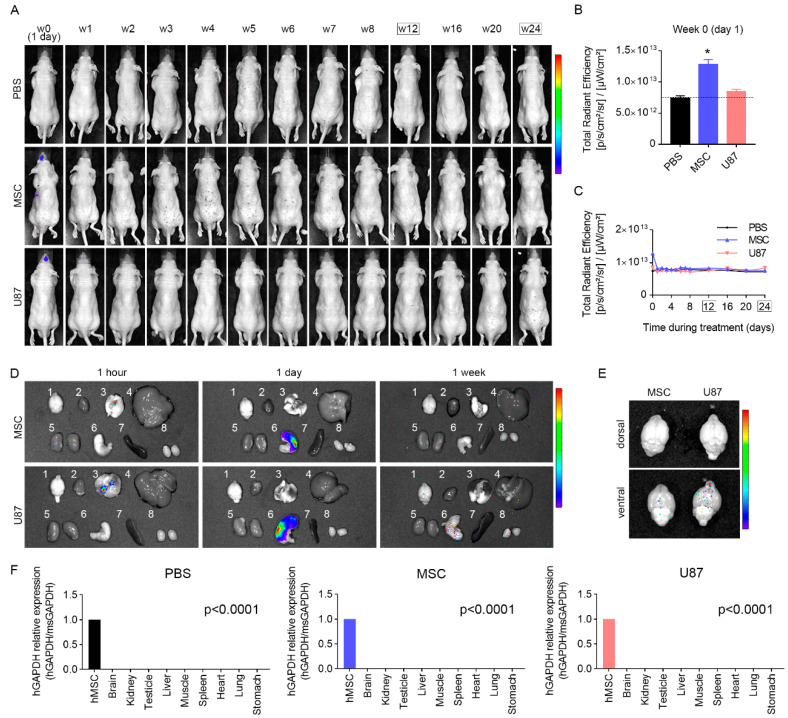
Mesenchymal stem cell (MSC)-based therapy is a promising therapeutic approach in the management of several pathologies, including central nervous system diseases. Previously, we demonstrated the therapeutic potential of human adipose-derived MSCs for neurological sequelae of oncological radiotherapy using the intranasal route as a non-invasive delivery method. However, a comprehensive investigation of the safety of intranasal MSC treatment should be performed before clinical applications. Here, we cultured human MSCs in compliance with quality control standards and administrated repeated doses of cells into the nostrils of juvenile immunodeficient mice, mimicking the design of a subsequent clinical trial. Short- and long-term effects of cell administration were evaluated by in vivo and ex vivo studies. No serious adverse events were reported on mouse welfare, behavioral performances, and blood plasma analysis. Magnetic resonance study and histological analysis did not reveal tumor formation or other abnormalities in the examined organs of mice receiving MSCs. Biodistribution study reveals a progressive disappearance of transplanted cells that was further supported by an absent expression of human GAPDH gene in the major organs of transplanted mice. Our data indicate that the intranasal application of MSCs is a safe, simple and non-invasive strategy and encourage its use in future clinical trials.

Keywords: biosafety; cell therapy; intranasal delivery; mesenchymal stem cells; nervous system disorders.


Conflict of interest statement

The authors declare that the research was conducted in the absence of any commercial or financial relationships that could be construed as a potential conflict of interest.

Figures

Figure 1
Figure 1
Intranasal delivery of MSCs does not induce changes in mice welfare and functional performance. (A) Treated mice received a dose of cells per week during 4 consecutive weeks (5·105 cells/dose). All analyses were conducted between week 11 and 13 for short-term studies (referred as 12 weeks to simplify) and between week 23 and 25 for long-term studies (referred as 24 weeks to simplify). (B) Body weight of the animals during the course of the experiment. n = 8–20 per group. Color code of the stats correspond to the color of each experimental group (C) Body weight gain at the short-term evaluation. n = 8–20 per group. (D) Body weight gain at the long-term evaluation. n = 8–16 per group. (E) Exploratory activity of mice prior initiating serial behavioral testing showing no differences between any experimental group. n = 4–11 per group. (F) Time spent sniffing the stimuli (water, odorA and odorB) in an odor discrimination task at the short-term, showing an impaired olfactory ability in U87 mice. Statistical analysis is performed to detect the change of stimuli (i.e., water 6 vs. odorA 1 and odorA 6 vs. odorB 1) and is indicated with color code corresponding to each experimental group. n = 4–13 per group. (G) Discrimination index between familiar and novel object (discrimination index = [time exploring the new object-time exploring the familiar object]/[time exploring the familiar object+ time exploring the new object] × 100) in the test session of the Novel Object Recognition (NOR) task at the short-term. n = 4–13 per group. (H) Wirehang test performance at the short-term. n = 4–13 per group. (I) Rotarod test performance at the short-term. n = 4–13 per group. (J) Time spent sniffing the stimuli (water, odorA and odorB) in an odor discrimination task at the long-term, showing an impaired olfactory ability in U87 mice. Statistical analysis is performed to detect the change of stimuli (i.e., water 6 vs. odorA and odorA 6 vs. odorB 1) and is indicated with color code corresponding to each experimental group. n = 4–13 per group. (K) Discrimination index between familiar and novel object (discrimination index = [time exploring the new object-time exploring the familiar object]/[time exploring the familiar object+ time exploring the new object] × 100) in the test session of the Novel Object Recognition (NOR) task at the long-term. n = 12–4 per group. (L) Wirehang test performance at the long-term. n = 4–12 per group. (M) Rotarod test performance at the long-term. n = 4–13 per group. Data are represented as mean ± SEM. * p < 0.05, ** p < 0.01, *** p < 0.001, **** p < 0.0001 compared to CTR group; Mixed-model ANOVA (B), Two-way repeated-measures ANOVA (F,J). One-way ANOVA (CE,GI,KM).
Figure 2
Figure 2
Biochemistry analysis and determination of oxidative stress-related parameters in blood samples. Determination of different biochemical parameters (AN) and oxidative stress parameters (OS) in overnight fasted mice, 12 and 24 weeks-post cell treatment. ALB, albumin; ALP, alkaline phosphatase; ALT, alanine aminotransferase; AMYL, amilase; AST, aspartate aminotransferase; BIL, bilirubin; CAT, catalase activity; CHO, cholesterol; GLUC, glucose; GPx, glutathione peroxidase; GR, glutathione reductase; LDH, lactate dehydrogenase; Mg, magnesium; TBARS, thiobarbituric acid reactive substances; TEAC, Trolox equivalent antioxidant capacity; TP, total proteins; TRIGL, triglycerides; UA, uric acid. Data are represented as mean ± SEM. n = 8–11 per group at 12 weeks-post cell treatment and n = 3–11 per group at 24 weeks-post cell treatment. * p < 0.05, ** p < 0.01, *** p < 0.001 compared to CTR group; One-way ANOVA.
Figure 3
Figure 3
Analysis of inflammatory cytokine in blood plasma. Cytokine profile in the plasma of overnight fasted mice, 12 and 24 weeks-post cell treatment. (AR) Bar graphs show the concentration levels of the cytokines. G-CSF, Granulocyte colony-stimulating factor; GM-CSF, Granulocyte Macrophage Colony-Stimulating Factor; IFN-γ, Interferon gamma; IL-1α, Interleukin 1 alpha; IL-1β, Interleukin 1 beta; IL-2, Interleukin 2; IL-5, Interleukin 5; IL-6, Interleukin 6; IL-9, Interleukin 9; IL-10, Interleukin 10; IL-12 (p40), Interleukin 12 subunit p40; IL-12 (p70), Interleukin 12 subunit p70; IL-17A, Interleukin 17A; KC, Keratinocytes-derived chemokine; MCP-1, Monocyte chemoattractant protein-1; TNF-α, Tumor necrosis factor α. Data are represented as mean ± SEM. n = 4–10 per group. * p < 0.05, ** p < 0.01, *** p < 0.001 compared to CTR group, unless otherwise indicated; One-way ANOVA.
Figure 4
Figure 4
Intranasal administration of MSCs does not induce anomalies in the brain and other main organs in vivo. (A) Axial MRI sequence of the brain of a representative MSC animal at the long-term. (B) 1H-MRS in the olfactory bulb, hippocampus and cerebellum of mice at the long-term. (C) Coronal MRI sequence of the abdomen of a representative MSC animal at the long-term. Cr, creatine; Cer, cerebellum; Cho, choline; Ctx, cortex; GABA, g-aminobutyric acid; Hp, hippocampus; Kid, kidney; Lip, Lipid; Liv, liver; MM, macromolecules; Myo-Ins, Myo-inositol; NAA, N-acetylaspartate; NAAG, N-acetylaspartatylglutamate; OB, olfactory bulb; PCr, phosphocreatine; Spl, spleen; St, striatum; Sto, stomach; Tau, taurine; tCr, total creatine. n = 3–4 per group.
Figure 5
Figure 5
Long-term histological analysis of the major organs does not evidence lesions after intranasal administration of MSCs. Representative images of hematoxylin and eosin staining of major mouse organs for the different experimental groups. (A) Comparative histological images of the olfactory bulb, liver, spleen, kidney, skeletal muscle, and testicle. Note that CTR, PBS and MSC animals did not show histological lesions, while U87 mice did. (B) Liver tissue from U87 mouse showing cellular infiltration in the periportal area (arrow). (C). Spleen tissue from U87 mouse with megakaryocytes (arrowhead) indicating a extramedullary hematopoiesis. (D) Atypical axillary mass from U87 mouse with a germinal center (GC) and a nodule (N) that identifies with as hyperplastic lymphatic ganglia. (E) Atypical nose cyst (Cy) from U87 mouse with inflammation (In) of the adjacent tissue. Scale bar: (A) 400 µm; (BD) 50 µm, (E) 100 µm. n = 3–4 per group.
Figure 6
Figure 6
Biodistribution suggests a progressive disappearance of transplanted cells. (A) Representative images showing in vivo fluorescence signal in the body of mice at different weeks (w) after cell delivery and until the end of the monitoring period. (B) Quantification of the in vivo fluorescence signal in the body at day 1 (week 0) post-transplant. n = 4–5 per group. (C) Over time quantification of the in vivo fluorescence signal in the body of mice after cell delivery. n = 4–5 per group. (D) Fluorescence signal in dissected major organs 1 h-, 1 day- and 1 week-post cell delivery. The examined organs were brain (1), heart (2), lungs (3), liver (4), kidneys (5), stomach (6), spleen (7), and testicles (8). (E) Fluorescence signal in dissected brains of MSC and U87 mice 1 day-post cell delivery (dorsal and ventral view). (F) RT-qPCR quantification of the human GAPDH gene expression in the major organs of PBS, MSC and U87 mice, 24-weeks after cell administration. Expression levels were normalized to the endogenous control mouse GAPDH. n = 3 per group. Data are represented as mean ± SEM. * p < 0.05 compared to CTR group. One-way ANOVA in B and F. One-way repeated-measures ANOVA in C. Rainbow color scale: red indicates highest fluorescence signal and blue indicates lowest fluorescence signal.

References

    1. Rushkevich Y.N., Kosmacheva S.M., Zabrodets G.V., Ignatenko S.I., Goncharova N.V., Severin I.N., Likhachev S.A., Potapnev M.P. The Use of Autologous Mesenchymal Stem Cells for Cell Therapy of Patients with Amyotrophic Lateral Sclerosis in Belarus. Bull. Exp. Biol. Med. 2015;159:576–581. doi: 10.1007/s10517-015-3017-3. - DOI - PubMed
    1. Gotherstrom C., Westgren M., Shaw S.W., Astrom E., Biswas A., Byers P.H., Mattar C., Graham G., Taslimi J., Uwe U., et al. Pre- and postnatal transplantation of fetal mesenchymal stem cells in osteogenesis imperfecta: A two-center experience. Stem Cells Transl. Med. 2014;3:255–264. doi: 10.5966/sctm.2013-0090. - DOI - PMC - PubMed
    1. Vega A., Martin-Ferrero M.A., Del Canto F., Alberca M., Garcia V., Munar A., Orozco L., Soler R., Fuertes J., Huguet M., et al. Treatment of Knee Osteoarthritis With Allogeneic Bone Marrow Mesenchymal Stem Cells: A Randomized Controlled Trial. Transplantation. 2015;99:1681–1690. doi: 10.1097/TP.0000000000000678. - DOI - PubMed
    1. Connick P., Kolappan M., Crawley C., Webber D.J., Patani R., Michell A.W., Du M.-Q., Luan S.-L., Altmann D.R., Thompson A.J., et al. Autologous mesenchymal stem cells for the treatment of secondary progressive multiple sclerosis: An open-label phase 2a proof-of-concept study. Lancet Neurol. 2012;11:150–156. doi: 10.1016/S1474-4422(11)70305-2. - DOI - PMC - PubMed
    1. Thakkar U.G., Trivedi H.L., Vanikar A.V., Dave S.D. Insulin-secreting adipose-derived mesenchymal stromal cells with bone marrow–derived hematopoietic stem cells from autologous and allogenic sources for type 1 diabetes mellitus. Cytotherapy. 2015;17:940–947. doi: 10.1016/j.jcyt.2015.03.608. - DOI - PubMed