. 2021 Mar 9;13(5):1184.
doi: 10.3390/cancers13051184.

Integrin α10-Antibodies Reduce Glioblastoma Tumor Growth and Cell Migration

Affiliations

Integrin α10-Antibodies Reduce Glioblastoma Tumor Growth and Cell Migration

Katarzyna Chmielarska Masoumi et al. Cancers (Basel). .

Abstract

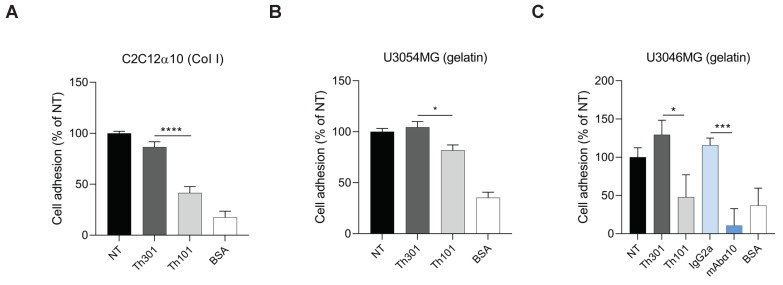
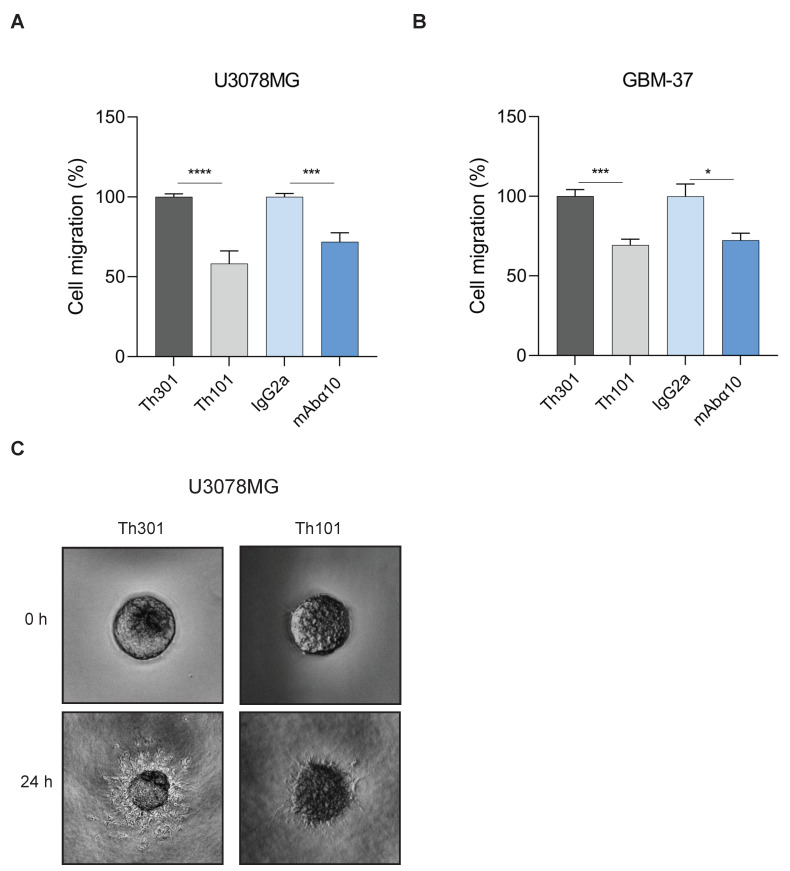
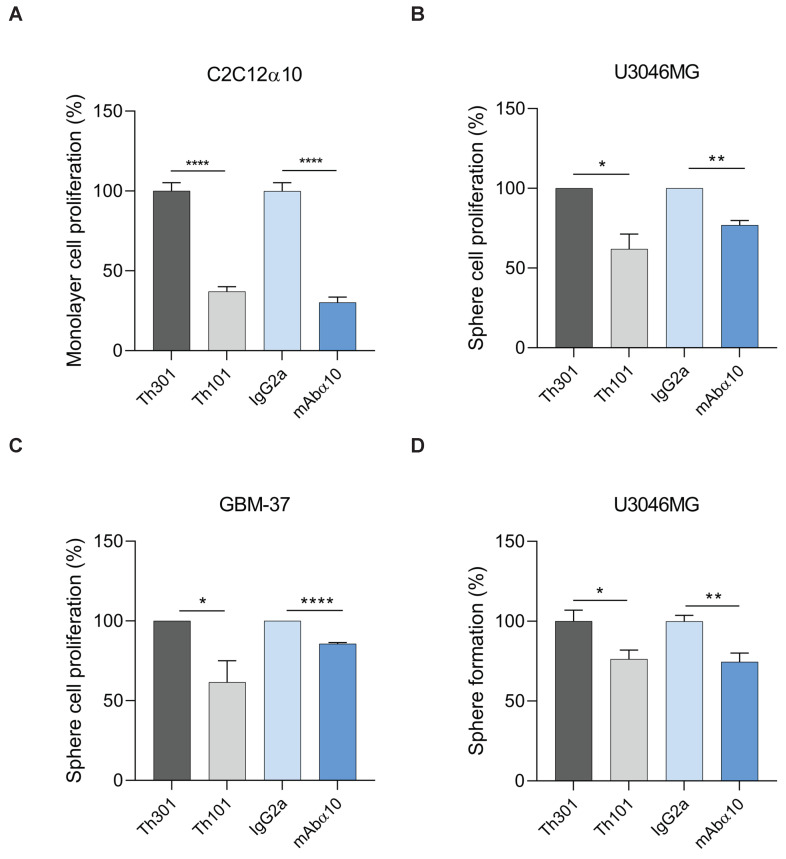
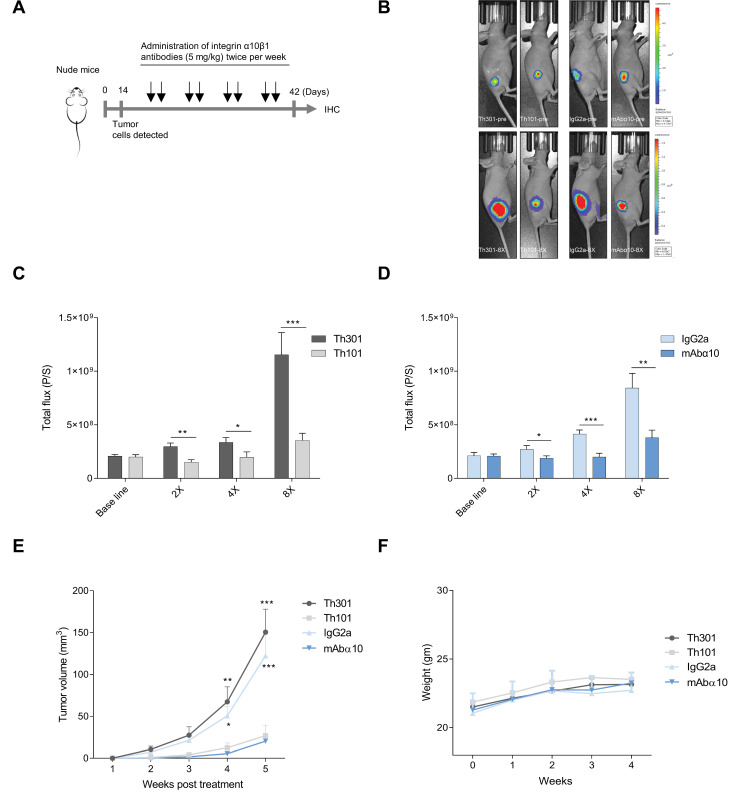
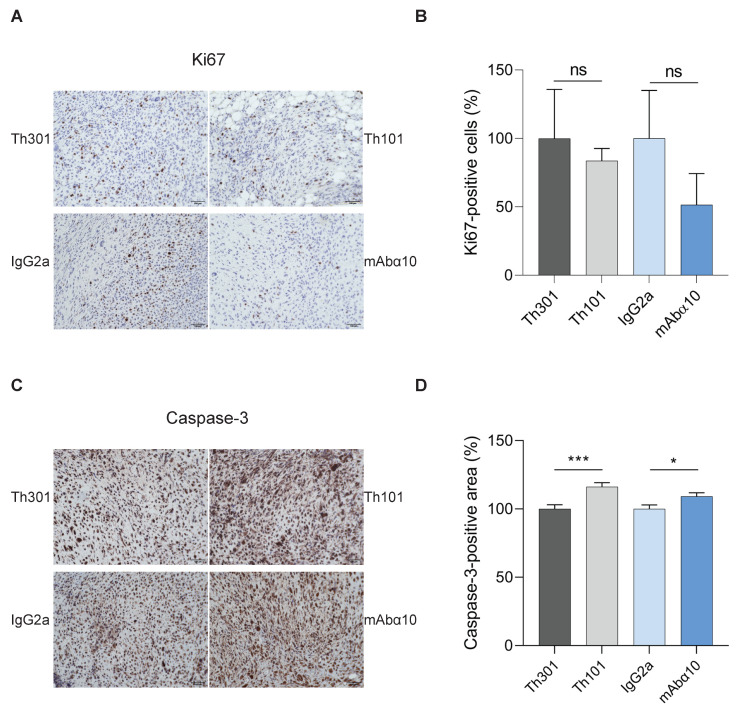
Glioblastoma (GB) is the most common and the most aggressive form of brain tumor in adults, which currently lacks efficient treatment strategies. In this study, we investigated the therapeutic effect of function-blocking antibodies targeting integrin α10β1 on patient-derived-GB cell lines in vitro and in vivo. The in vitro studies demonstrated significant inhibiting effects of the integrin α10 antibodies on the adhesion, migration, proliferation, and sphere formation of GB cells. In a xenograft mouse model, the effect of the antibodies on tumor growth was investigated in luciferase-labeled and subcutaneously implanted GB cells. As demonstrated by in vivo imaging analysis and caliper measurements, the integrin α10-antibodies significantly suppressed GB tumor growth compared to control antibodies. Immunohistochemical analysis of the GB tumors showed lower expression of the proliferation marker Ki67 and an increased expression of cleaved caspase-3 after treatment with integrin α10 antibodies, further supporting a therapeutic effect. Our results suggest that function-blocking antibody targeting integrin α10β1 is a promising therapeutic strategy for the treatment of glioblastoma.

Keywords: collagen; function-blocking antibody; glioblastoma; integrin α10β1; migration; tumor growth.


Conflict of interest statement

E.L.-Å., K.C.M., and X.H. own shares in Xintela AB; K.C.M., X.H., and E.L.-Å. are employed by Xintela AB. The other authors declare no conflicts of interest.

Figures

Figure 1
Figure 1
Integrin α10 antibodies bind specifically to the integrin α10 subunit. (A) Binding of the integrin α10 antibodies Th101 and mAbα10 and the human isotype control antibody Th301 to C2C12 cell lines overexpressing integrin α10 (C2C12α10) or integrin α11 (C2C12α11). (B) Specific binding of Th101 and mAbα10 to C2C12α10 cells. The gates were set to unstained cell samples. The figure shows cell plot shift when the C2C12α10 cells were stained with the integrin α10 human Th101 and mouse mAbα10 antibodies, but not with human Th301 and mouse immunogloblin G 2a (IgG2a) control antibodies or integrin α11 mouse monoclonal antibody (mAbα11). In C2C12α11 cells, there was a clear cell plot shift when the cells were stained with mAbα11, but not with Th101 and mAbα10. (C) Binding competition assay between the integrin α10 antibodies mAbα10 and Th101 using C2C12α10 cells. Data are expressed as mean fluorescence intensity (MFI) of 100,000 cells. Cells were incubated with antibodies at the indicated concentrations (μg/mL) and subsequently incubated with secondary antibodies. Immunolabeled cells were analyzed by flow cytometry. Data are compiled from at least three independent experiments as mean ± SE.
Figure 2
Figure 2
Glioblastoma (GB) spheroid cultures increase the expression of integrin α10β1. Flow cytometry analysis of the collagen-binding integrins subunits α10, α11, α1, and α2 on patient-derived GBM cell lines U3054MG, U3046MG, U3078MG, and GBM-37 grown either in monolayer (A) or in spheroid (B) cultures. The bar graphs show the percentage of integrin-positive cells compared to the whole cell population. (C) Representative immunofluorescent staining of integrin α10β1 in a GB tumor derived from U3054MG cells and grown in vivo. The scale bar represents 20 µm. Data are compiled from at least three independent experiments as mean ± SE.
Figure 3
Figure 3
Integrin α10 antibodies inhibit GB cell adhesion to collagen and gelatin. Adhesion of C2C12α10 (A), U3054MG (B), and U3046MG (C) cells to dishes pre-coated with collagen I (Col I) or gelatin for 1 h in the absence or presence of integrin α10 antibodies (Th101 and mAbα10) or control antibodies (Th301 and IgG2a). Bovine serum albumin (BSA)-coated wells were used as a negative control. Adhered cells were quantified by crystal violet and spectrophotometric analysis. The bar graph shows the percentage of cell adhesion compared with non-treated (NT) cells. Data are compiled from three independent experiments as mean ± SE. Unpaired two-tailed Student t-test was applied. Four levels of significance were used for a 95% confidence interval, where * p < 0.05; *** p < 0.001; and **** p < 0.0001.
Figure 4
Figure 4
Integrin α10 antibodies inhibit GB cell migration. Spheroids composed of U3078MG (A) or GBM-37 (B) cells were embedded in collagen I gel and treated with integrin α10 monoclonal antibodies Th101 and mAbα10 or isotype control antibodies Th301 and IgG2a at 10 µg/mL. Spheroid migration was analyzed after 24 h. Relative migration was quantified as spheroid area difference (in pixels) at the indicated time points after subtraction of spheroid are at day 0. Data are expressed as mean ± SE of three independent experiments. (C) Representative pictures of U3078MG spheroids taken 24 h after embedding cells in the collagen gel (4× magnification). Unpaired two-tailed Student t-test was applied. Four levels of significance were used for a 95% confidence interval, where * p < 0.05; *** p < 0.001; and **** p < 0.0001.
Figure 5
Figure 5
Integrin α10 antibodies inhibit GB cell proliferation and sphere formation (A) C2C12α10 cells were seeded in 96-well plates pre-coated with 20 µg/mL of collagen I (Col I). Cells were treated with Th101, mAbα10 antibodies or their isotype controls Th301 or IgG2a at 10 µg/mL concentration. After 24 h of incubation with the different antibodies, BrdU was added for incorporation into dividing cells during DNA synthesis and to detect proliferation. C2C12α10 cell proliferation was decreased in the presence of both human and mouse integrin α10 antibodies, but not by the control antibodies. (B,C) U3046MG and GBM-37 glioblastoma cells were seeded as sphere cultures and treated with 10 µg/mL of Th101, mAbα10, or control antibodies for 8 days. Twenty-four hours before harvest, BrdU was added. Cells were stained with APC-conjugated anti-BrdU antibody to measure the amount of BrdU incorporated in the replicating cells. The mean fluorescence intensity of BrdU was determined by flow cytometry and is shown as BrdU intensity of anti-integrin α10-treated cells normalized to its isotype control. (D) U3046MG cells were grown as spheres in the presence or absence of 10 µg/mL of Th101, mAbα10, Th301, or IgG2a. The number of spheres was analyzed on day 8 (mean ± SE). The number of spheres per field of microscope view in each experimental group was quantified by Fiji software and statistical analysis of the average diameter of spheres. All results were from at least three independent experiments with triplicates in each experiment and expressed as mean ± SE. Unpaired two-tailed Student t-test was applied. Four levels of significance were used for a 95% confidence interval, where * p < 0.05; ** p < 0.01; and **** p < 0.0001.
Figure 6
Figure 6
Anti-tumor efficacy of integrin α10 antibodies on xenograft glioblastoma in mice. (A) A schematic presentation of the in vivo experiment. (B) Photographic and 2D bioluminescence overlay images from representative mice from each treatment group before (Top) and after (Lower) treatment onset. The growth of U3054MG xenograft tumors treated with the integrin antibodies Th101 (C) and mAbα10 (D), and the control antibody Th301 and IgG2a. A total of 2 × 10⁶ U3054MG cells were injected subcutaneously into the right flank. After treatment onset, tumor progression in nude mice was monitored by luciferase live imaging weekly. The 2D bioluminescence signal measured as total flux (P/S) from each mouse was collected to evaluate tumor sizes of the Th101 and mAbα10-treatment groups as well as the Th301 and IgG2a-treatment groups. The data show the mean total flux (P/S) of all animals in each group at the indicated time point ± SE. The Mann–Whitney test was used to compare the difference between α10 antibody and control antibody and each treatment time point where * p < 0.05; ** p < 0.01; and *** p < 0.001. (E) The tumor size (mm3) in mice was measured by Vernier calipers during the treatment time. The two-way ANOVA test followed by Bonferroni’s multiple comparison test was applied. Four levels of significance were used for a 95% confidence interval, where * p < 0.05; ** p < 0.01; and *** p < 0.001. (F) Whole-body weight (gm) of the mice in each group measured over 4 weeks. Data are expressed as mean ± SE.
Figure 7
Figure 7
Integrin α10 antibody treatment reduces Ki67 and increases cleaved caspase-3 in GB tumors. (A) Representative immunohistochemical images of expression of Ki67 in the xenograft tumors from mice treated with control antibodies (Th301 and IgG2a) or integrin α10 antibodies (Th101 and mAbα10). Scale bars represent 10 µm. (B) The percentage of Ki67-positive cells in the tumors was reduced in Th101- and mAbα10-treated mice (n = 4 and n = 5, respectively). (C) Representative immunohistochemical images of cleaved caspase-3 expressions in xenograft tumors from mice treated with control antibodies (Th301 and IgG2a) or integrin α10 antibodies (Th101 and mAbα10). The scale bar represents 100 μm. (D) The percentage of cleaved caspase-3-positive cell area in the tumors was significantly increased in Th101- and mAbα10-treated mice compared to control mice. Results are presented as the mean ± SE from six tumor samples per group. Unpaired two-tailed Student t-test was applied. Four levels of significance were used for a 95% confidence interval, where * p < 0.05; *** p < 0.001; and ns: no significant.

Similar articles

Cited by

References

    1. Li R., Li H., Yan W., Yang P., Bao Z., Zhang C., Jiang T., You Y. Genetic and clinical characteristics of primary and secondary glioblastoma is associated with differential molecular subtype distribution. Oncotarget. 2015;6:7318–7324. doi: 10.18632/oncotarget.3440. - DOI - PMC - PubMed
    1. Ohgaki H., Kleihues P. Epidemiology and etiology of gliomas. Acta Neuropathol. 2005;109:93–108. doi: 10.1007/s00401-005-0991-y. - DOI - PubMed
    1. Furnari F.B., Fenton T., Bachoo R.M., Mukasa A., Stommel J.M., Stegh A., Hahn W.C., Ligon K.L., Louis D.N., Brennan C., et al. Malignant astrocytic glioma: Genetics, biology, and paths to treatment. Genes Dev. 2007;21:2683–2710. doi: 10.1101/gad.1596707. - DOI - PubMed
    1. Lamborn K.R., Chang S.M., Prados M.D. Prognostic factors for survival of patients with glioblastoma: Recursive parti-tioning analysis. Neuro. Oncol. 2004;6:227–235. doi: 10.1215/S1152851703000620. - DOI - PMC - PubMed
    1. Stark A.M., van de Bergh J., Hedderich J., Mehdorn H.M., Nabavi A. Glioblastoma: Clinical characteristics, prognostic factors and survival in 492 patients. Clin. Neurol. Neurosurg. 2012;114:840–845. doi: 10.1016/j.clineuro.2012.01.026. - DOI - PubMed