. 2021 Mar 9;22(5):2780.
doi: 10.3390/ijms22052780.

Microglial Heterogeneity and Its Potential Role in Driving Phenotypic Diversity of Alzheimer's Disease

Affiliations

Microglial Heterogeneity and Its Potential Role in Driving Phenotypic Diversity of Alzheimer's Disease

Stefano Sorrentino et al. Int J Mol Sci. .

Abstract

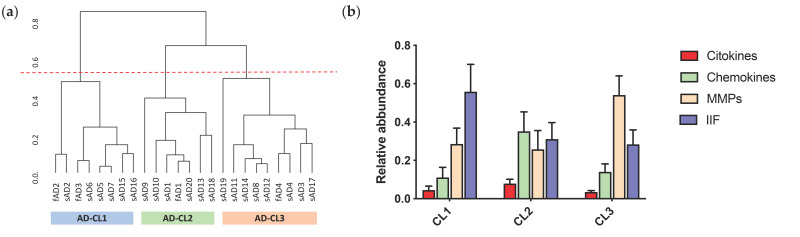
Alzheimer's disease (AD) is increasingly recognized as a highly heterogeneous disorder occurring under distinct clinical and neuropathological phenotypes. Despite the molecular determinants of such variability not being well defined yet, microglial cells may play a key role in this process by releasing distinct pro- and/or anti-inflammatory cytokines, potentially affecting the expression of the disease. We carried out a neuropathological and biochemical analysis on a series of AD brain samples, gathering evidence about the heterogeneous involvement of microglia in AD. The neuropathological studies showed differences concerning morphology, density and distribution of microglial cells among AD brains. Biochemical investigations showed increased brain levels of IL-4, IL-6, IL-13, CCL17, MMP-7 and CXCL13 in AD in comparison with control subjects. The molecular profiling achieved by measuring the brain levels of 25 inflammatory factors known to be involved in neuroinflammation allowed a stratification of the AD patients in three distinct "neuroinflammatory clusters". These findings strengthen the relevance of neuroinflammation in AD pathogenesis suggesting, in particular, that the differential involvement of neuroinflammatory molecules released by microglial cells during the development of the disease may contribute to modulate the characteristics and the severity of the neuropathological changes, driving-at least in part-the AD phenotypic diversity.

Keywords: Alzheimer’s disease; Aβ; MMPs; chemokines; cytokines; dementia; heterogeneity; innate immunity factors; microglia; neuroinflammation.


Conflict of interest statement

The authors declare no conflict of interest. The funders had no role in the design of the study; in the collection, analyses, or interpretation of data; in the writing of the manuscript, or in the decision to publish the results.

Figures

Figure 1
Figure 1
Microglial characterization in fAD cases. (a,d,g,j,m) APPA673V (fAD1); (b,e,h,k,n) APPA713V (fAD2); (c,f,i,l,o) PS1P117A (fAD3). Scale bar 1 mm (ac) 200 μm (df); 50 μm (gi). (ai) Frontal cortex sections immunostained with the IBA1 antibody. (jl) Morphological shape extracted and edited by imageJ software analysis. (mo) Quantification of IBA1 immunoreactivity based on the intensity and number of pixels (data were normalized respect to the higher signal obtained among Alzheimer’s disease (AD) samples).
Figure 2
Figure 2
Microglial characterization in sAD cases. (a,d,g,j,m) sAD6; (b,e,h,k,n) sAD19; (c,f,i,l,o) sAD21. Scale bar 1 mm (ac) 200 μm (df); 50 μm (gi). (ai) Frontal cortex sections immunostained with the IBA1 antibody. Arrows in (a) highlight the bilayer distribution of microglial cells across the frontal cortex. (jl) Morphological shape extracted and edited by imageJ software analysis. (mo) Quantification of IBA1 immunoreactivity based on the intensity and number of pixels (data were normalized respect to the higher signal obtained among AD samples).
Figure 3
Figure 3
Comparison between AD and control samples. Boxplots of the most significant analytes, IL-4, IL-6, IL-13, CCL17, MMP-7, CXCL13. * p < 0.05, ** p < 0.005, *** p < 0.001. For IL-6 the most extreme observations have been omitted for a better graphical representation.
Figure 4
Figure 4
Comparison between pro- and anti-inflammatory cytokines in AD and control samples. Boxplot of the pro-inflammatory (IFN-γ, IL-1ɑ, IL-2, IL-6, IL-12 p70, IL-18) and the anti-inflammatory (IL-1rn, IL-4, IL-13) cytokines are shown for AD (p-value < 0.0001) (a) and control (p-value 0.29) (b) group. * p < 0.05, *** p < 0.001. Dots indicate outlier values. Natural logarithm scale has been used for a better graphical representation.
Figure 5
Figure 5
Families of neuroinflammatory factors. (a) STRING network highlights the direct (physical) and indirect (functional) connection of elements belongs to each family. Known interactions: from curated databases (light blue), experimentally determined (purple); predicted interactions: gene neighborhood (green), gene fusions (red), gene co-occurrence (blue); other interactions: text mining (yellow), co-expression (black), protein homology (grey). (b) Pie graph indicates the relative distribution of cytokines (red), chemokines (green), MMPs (pink) and IIFs (blue) within the AD group. (c) The heat map shows correlations between the four neuroinflammatory classes and clinical, neuropathological and biological data. Aβ42 levels in the insoluble fraction of brain homogenates (Aβ42i); Aβ40 levels in the insoluble fraction of brain homogenates (Aβ40i); Aβ42 levels in the soluble fraction of brain homogenates (Aβ42s); Aβ40 levels in the soluble fraction of brain homogenates (Aβ40s).
Figure 6
Figure 6
(a) Hierarchical Cluster Analysis (HCA) shows the different subgroups of AD patients characterized by different expression of neuroinflammatory molecular factors. In abscissa, there are the AD patients and the ordinate corresponds to the complete linkage measured by Euclidean distance. The dashed red line represents the cut off for three clusters (CL): AD-CL1 in yellow; AD-CL2 in red; AD-CL3 in light blue. (b) Histogram concerning the relative abundance of each inflammatory family (cytokines in red, chemokines in green, matrix-metalloproteinases (MMPs) in cream and Innate immunity factors in blue) within each cluster.

Similar articles

Cited by

References

    1. Morris J.C. Early-stage and preclinical Alzheimer disease. Alzheimer Dis. Assoc. Disord. 2005;19:163–165. - PubMed
    1. Khoury R., Grossberg G.T. Deciphering Alzheimer’s disease: Predicting new therapeutic strategies via improved understanding of biology and pathogenesis. Expert Opin. Ther. Targets. 2020;24:859–868. doi: 10.1080/14728222.2020.1790530. - DOI - PubMed
    1. Hardy J.A., Higgins G.A. Alzheimer’s disease: The amyloid cascade hypothesis. Science. 1992;256:184–185. doi: 10.1126/science.1566067. - DOI - PubMed
    1. McGeer P.L., McGeer E.G. The amyloid cascade-inflammatory hypothesis of Alzheimer disease: Implications for therapy. Acta Neuropathol. 2013;126:479–497. doi: 10.1007/s00401-013-1177-7. - DOI - PubMed
    1. Sarlus H., Heneka M.T. Microglia in Alzheimer’s disease. J. Clin. Investig. 2017;127:3240–3249. doi: 10.1172/JCI90606. - DOI - PMC - PubMed

LinkOut - more resources