. 2021 Mar 18;21(6):2139.
doi: 10.3390/s21062139.

Neural Network for Enhancing Microscopic Resolution Based on Images from Scanning Electron Microscope

Affiliations

Neural Network for Enhancing Microscopic Resolution Based on Images from Scanning Electron Microscope

Chia-Hung Dylan Tsai et al. Sensors (Basel). .

Abstract

In this paper, an artificial neural network is applied for enhancing the resolution of images from an optical microscope based on a network trained with the images acquired from a scanning electron microscope. The resolution of microscopic images is important in various fields, especially for microfluidics because the measurements, such as the dimension of channels and cells, largely rely on visual information. The proposed method is experimentally validated with microfluidic structure. The images of structural edges from the optical microscope are blurred due to optical effects while the images from the scanning electron microscope are sharp and clear. Intensity profiles perpendicular to the edges and the corresponding edge positions determined by the scanning electron microscope images are plugged in a neural network as the input features and the output target, respectively. According to the results, the blurry edges of the microstructure in optical images can be successfully enhanced. The average error between the predicted channel position and ground truth is around 328 nanometers. The effects of the feature length are discussed. The proposed method is expected to significantly contribute to microfluidic applications, such as on-chip cell evaluation.

Keywords: artificial neural network; image enhancement; microfluidics; microscope.


Conflict of interest statement

The authors declare no conflict of interest.

Figures

Figure 1
Figure 1
An overview of the proposed method for enhancing the resolution of an optical microscope (OM). (a) A microfluidic chip and its structure observed with an OM and a scanning electron microscopy (SEM). (b) The edges of the structure are in bold lines due to the optical effects. Artificial neural network is applied to predict the edge position and to enhance the image.
Figure 2
Figure 2
The flowcharts of the proposed method of (a) training process and (b) predicting process.
Figure 3
Figure 3
Microscopes for obtaining images. (a) Optical microscope. (b) Scanning electron microscope and a sample image taken from it.
Figure 4
Figure 4
The design of the microfluidic chip and the chosen locations for machine learning.
Figure 5
Figure 5
The structure of the neural network.
Figure 6
Figure 6
The image modification for sharpening the edge with a predicted edge position.
Figure 7
Figure 7
Preprocess for image calibrations. (a) Scaling. (b) Positioning and rotation.
Figure 8
Figure 8
Scaled and aligned images from both microscopes with highlights on structural features. (a) Images from OM. (b) Images from SEM.
Figure 9
Figure 9
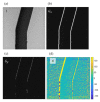
The directions perpendicular to the edge points are determined using Sobel operators. (a) Original image taken from the SEM. (b) The intensity gradients in the horizontal direction. (c) The intensity gradients in the vertical direction. (d) The directions of intensity gradients in degrees.
Figure 10
Figure 10
Intensity profiles in OM and SEM image samples. (a) OM image. (b) SEM image.
Figure 11
Figure 11
The performance of the network training for L = 100, NH = 20 and θ=15°. (a) Regression plots with different data sets. (b) Convergence of training. (c) Error histogram of the predictions.
Figure 12
Figure 12
Examples of predicted edge position and the ground truth position from SEM images.
Figure 13
Figure 13
Comparison between original OM, enhanced OM, and SEM images.
Figure 14
Figure 14
Prediction errors among the channels with different zigzag angles.
Figure 15
Figure 15
Effects of different feature lengths L. (a) Training convergence. (b) Regression plots. (c) Enhanced images.
Figure 16
Figure 16
Effects of different feature length L.
Figure 17
Figure 17
The computational cost with different feature length.

References

    1. Verschueren H. Interference reflection microscopy in cell biology: Methodology and applications. J. Cell Sci. 1985;75:279–301. - PubMed
    1. Holden S.J., Uphoff S., Kapanidis A.N. DAOSTORM: An algorithm for high-density super-resolution microscopy. Nat. Methods. 2011;8:279–280. doi: 10.1038/nmeth0411-279. - DOI - PubMed
    1. Tsai C.-H.D., Sakuma S., Arai F., Kaneko M. A New Dimensionless Index for Evaluating Cell Stiffness-Based Deformability in Microchannel. IEEE Trans. Biomed. Eng. 2014;61:1187–1195. doi: 10.1109/TBME.2013.2296624. - DOI - PubMed
    1. Horade M., Tsai C.-H.D., Ito H., Kaneko M. Red Blood Cell Responses during a Long-Standing Load in a Microfluidic Constriction. Micromachines. 2017;8:100. doi: 10.3390/mi8040100. - DOI
    1. Tsai C.-H.D., Sakuma S., Arai F., Taniguchi T., Ohtani T., Sakata Y., Kaneko M. Geometrical alignment for improving cell evaluation in a microchannel with application on multiple myeloma red blood cells. RSC Adv. 2014;4:45050–45058. doi: 10.1039/C4RA08276A. - DOI