. 2021 Mar 15;22(6):2969.
doi: 10.3390/ijms22062969.

Antenna Protein Clustering In Vitro Unveiled by Fluorescence Correlation Spectroscopy

Affiliations

Antenna Protein Clustering In Vitro Unveiled by Fluorescence Correlation Spectroscopy

Aurélie Crepin et al. Int J Mol Sci. .

Abstract

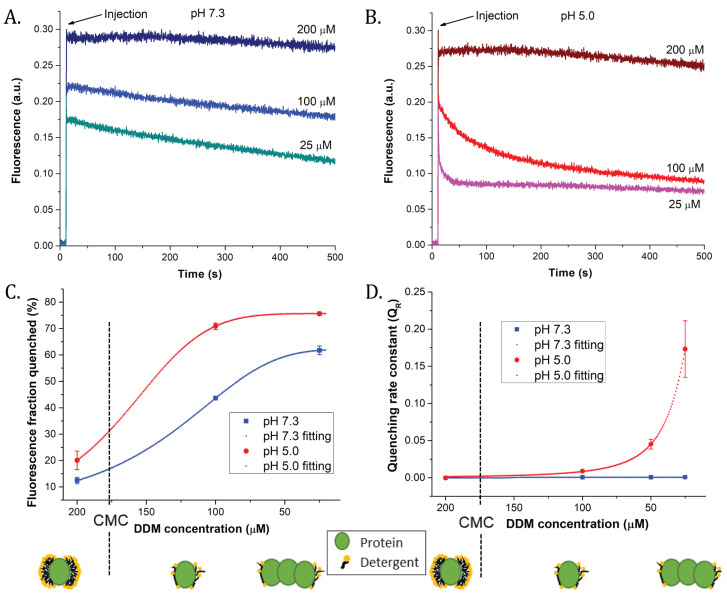
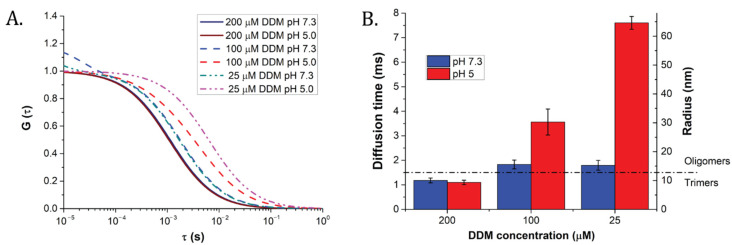
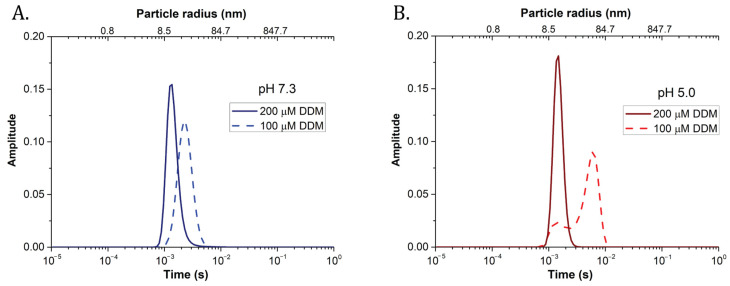
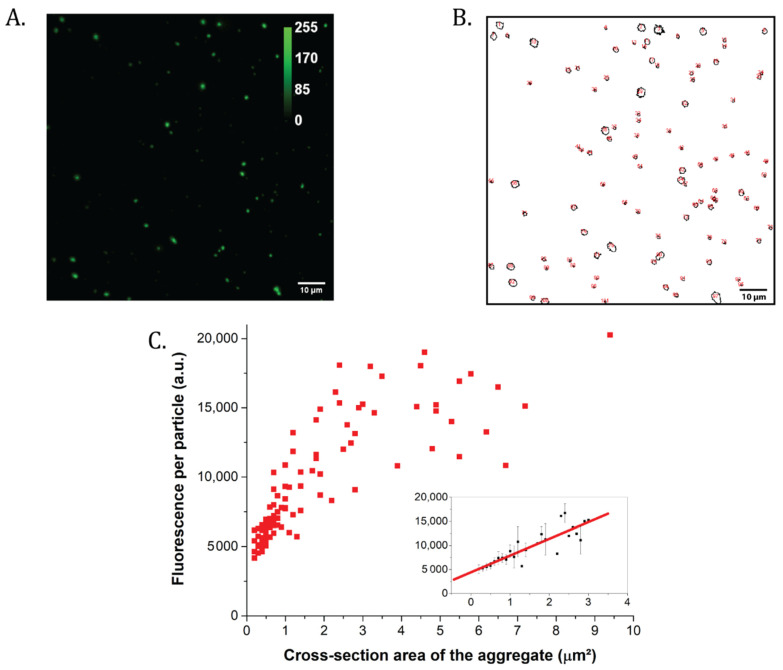
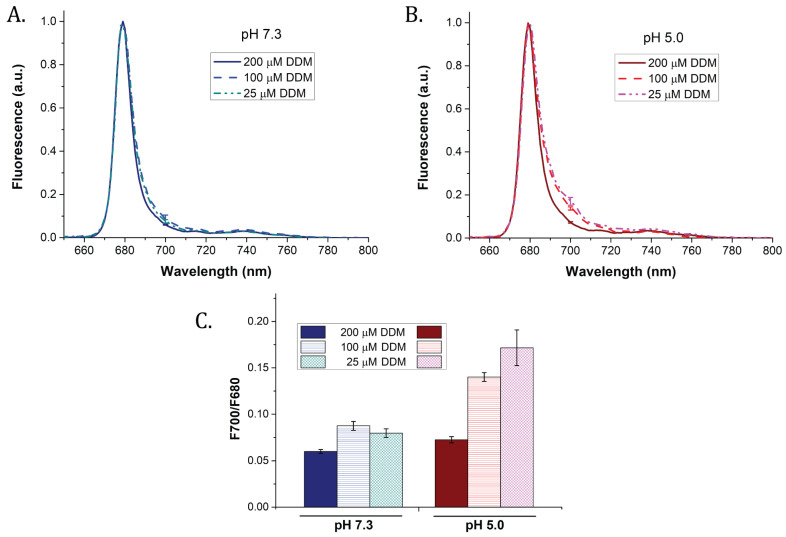
Antenna protein aggregation is one of the principal mechanisms considered effective in protecting phototrophs against high light damage. Commonly, it is induced, in vitro, by decreasing detergent concentration and pH of a solution of purified antennas; the resulting reduction in fluorescence emission is considered to be representative of non-photochemical quenching in vivo. However, little is known about the actual size and organization of antenna particles formed by this means, and hence the physiological relevance of this experimental approach is questionable. Here, a quasi-single molecule method, fluorescence correlation spectroscopy (FCS), was applied during in vitro quenching of LHCII trimers from higher plants for a parallel estimation of particle size, fluorescence, and antenna cluster homogeneity in a single measurement. FCS revealed that, below detergent critical micelle concentration, low pH promoted the formation of large protein oligomers of sizes up to micrometers, and therefore is apparently incompatible with thylakoid membranes. In contrast, LHCII clusters formed at high pH were smaller and homogenous, and yet still capable of efficient quenching. The results altogether set the physiological validity limits of in vitro quenching experiments. Our data also support the idea that the small, moderately quenching LHCII oligomers found at high pH could be relevant with respect to non-photochemical quenching in vivo.

Keywords: antenna proteins; detergent critical micelle concentration; fluorescence correlation spectroscopy; non-photochemical quenching; photoprotection; photosynthesis; protein oligomerization.


Conflict of interest statement

The authors declare no conflict of interest.

Figures

Figure 1
Figure 1
Fluorescence quenching analysis of LHCII trimers during bulk measurement in vitro. Panels (A,B) represent time course of fluorescence quenching of LHCII trimers (in HEPES 10 mM (pH 7.3) and 200 μM n-dodecyl-β-D-maltoside (DDM)) injected in a buffer of pH 7.3 (A) or 5.0 (B) at different detergent concentrations. (C) Titration curves of quenched fraction of fluorescence calculated from panels (A,B) (see the Section 4 for calculation). (D) Rate constants of fluorescence quenching, calculated by fitting time courses of fluorescence (A,B) with a sigmoidal Hill equation y = [axb]/[cb + xb] (see, for instance, [10,14]). Circles/squares = data average; dashed lines = data fittings; error bars: SD. Data are average of three measurements. The proposed organization of the detergent around the LHCII single trimer above and below critical micellar concentration (CMC) is represented under the graphs.
Figure 2
Figure 2
Averaged fittings of the autocorrelation functions and calculated diffusion times of LHCII trimers obtained by conventional (Levenberg–Marquardt) method. The full list of parameters obtained is presented in the Table 2. See Figures S2 and S3 for raw curves and weighted residuals of the fittings, respectively. (A) Averaged autocorrelation curves. A shift to longer diffusion times indicates an increased size of LHCII clusters. (B) Diffusion times and particle radii estimated from them (see the Section 4). The diffusion time threshold for a trimeric state of LHCII is marked with a dashed line. Results are the average of three independent measurements. Error bars: SD.
Figure 3
Figure 3
Maximum entropy FCS fitting method unveiled sample heterogeneity. Typical results obtained fitting FCS autocorrelation curves (see the Section 4) for samples prepared at 200 or 100 µM DDM, pH 7.3 (A), or pH 5.0 (B). The method allows for separating different diffusion components, highlighting possible size heterogeneity in LHCII clusters. The area below each trace was normalized to 1.
Figure 4
Figure 4
Analysis by confocal microscopy of the large LHCII particles formed below 25 μM DDM and pH 5.0. (A) Confocal microscopy picture of the LHCII particles precipitated at the bottom of the well. The fluorescence is presented in arbitrary units. Scalebar: 10 μm. (B) Analysis of the confocal picture from (A), with the cross-section of each detectable aggregate circled. (C) Fluorescence intensity per LHCII particles as a function of the measured cross-section area. Insert: zoom of the section between 0 and 3 μm2, with average particle fluorescence values and standard deviations. Red line: straight line fitting of the data; R2 = 0.8.
Figure 5
Figure 5
77K fluorescence emission spectra of the samples used for fluorescence quenching analyses of LHCII trimers (see Figure 1). Purified LHCII were incubated at different detergents (200, 100, or 25 μM DDM) and pH values (7.3 or 5.0) as in previous experiments. (A) Samples at pH 7.3; (B) samples at pH 5.0; (C) ratio of the fluorescence measured at 700 nm to the fluorescence at 680 nm for each sample. Results are the average of three replicates. Error bars: SD.

Similar articles

Cited by

References

    1. Liu Z., Yan H., Wang K., Kuang T., Zhang J., Gui L., An X., Chang W. Crystal structure of spinach major light-harvesting complex at 2.72 A resolution. Nature. 2004;428:287–292. doi: 10.1038/nature02373. - DOI - PubMed
    1. Standfuss R., van Scheltinga A.C.T., Lamborghini M., Kuhlbrandt W. Mechanisms of photoprotection and nonphotochemical quenching in pea light-harvesting complex at 2.5 A resolution. EMBO J. 2005;24:919–928. doi: 10.1038/sj.emboj.7600585. - DOI - PMC - PubMed
    1. Kana R., Vass I. Thermoimaging as a tool for studying light-induced heating of leaves Correlation of heat dissipation with the efficiency of photosystem II photochemistry and non-photochemical quenching. Environ. Exp. Bot. 2008;64:90–96. doi: 10.1016/j.envexpbot.2008.02.006. - DOI
    1. Holt N.E., Fleming G.R., Niyogi K.K. Toward an understanding of the mechanism of nonphotochemical quenching in green plants. Biochemistry. 2004;43:8281–8289. doi: 10.1021/bi0494020. - DOI - PubMed
    1. Goss R., Lepetit B. Biodiversity of NPQ. J. Plant Physiol. 2015;172:13–32. doi: 10.1016/j.jplph.2014.03.004. - DOI - PubMed

MeSH terms

LinkOut - more resources