. 2021 Mar 15;13(6):1309.
doi: 10.3390/cancers13061309.

HERC1 Regulates Breast Cancer Cells Migration and Invasion

Affiliations

HERC1 Regulates Breast Cancer Cells Migration and Invasion

Fabiana Alejandra Rossi et al. Cancers (Basel). .

Abstract

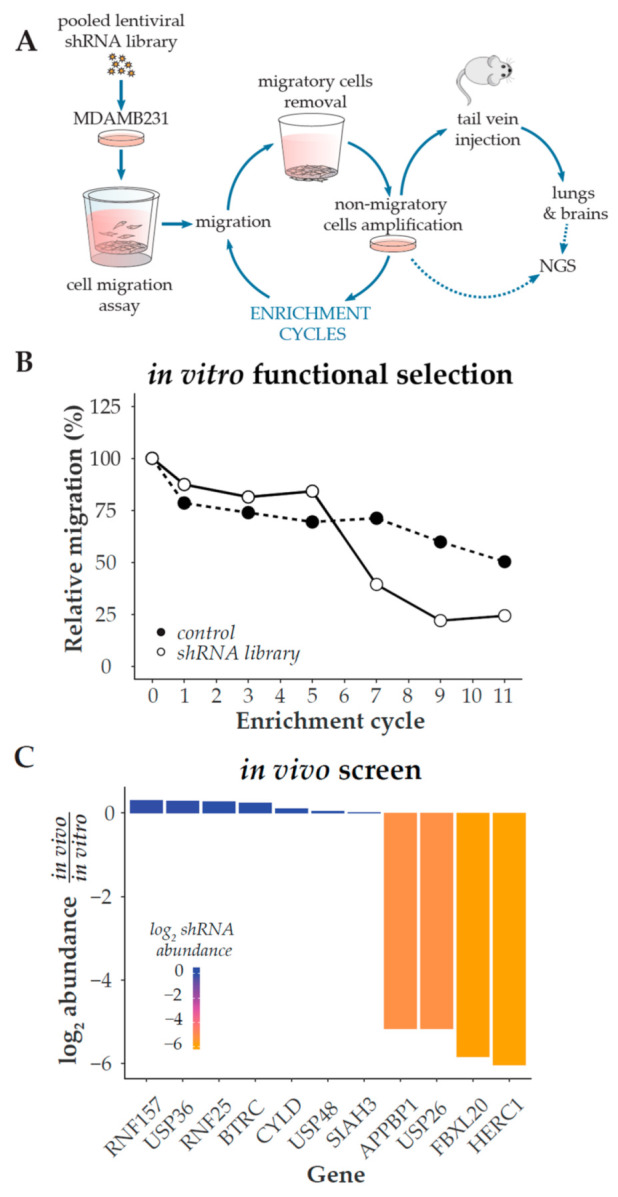
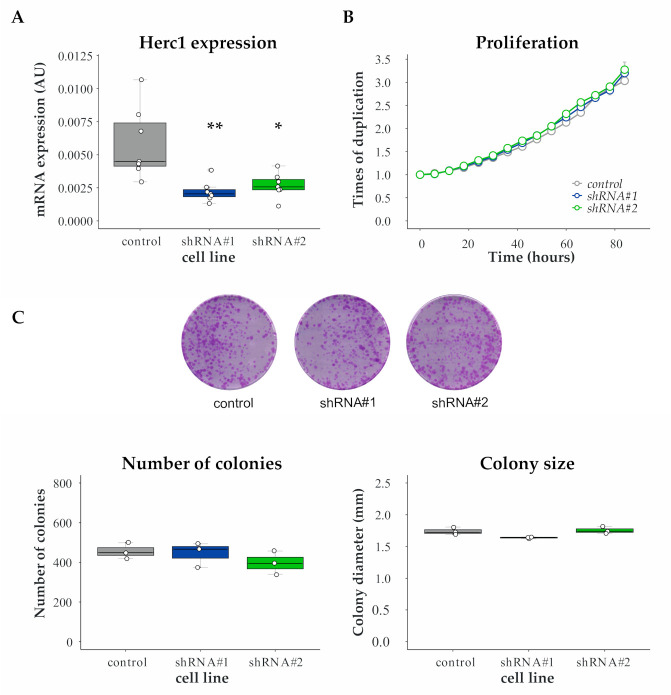
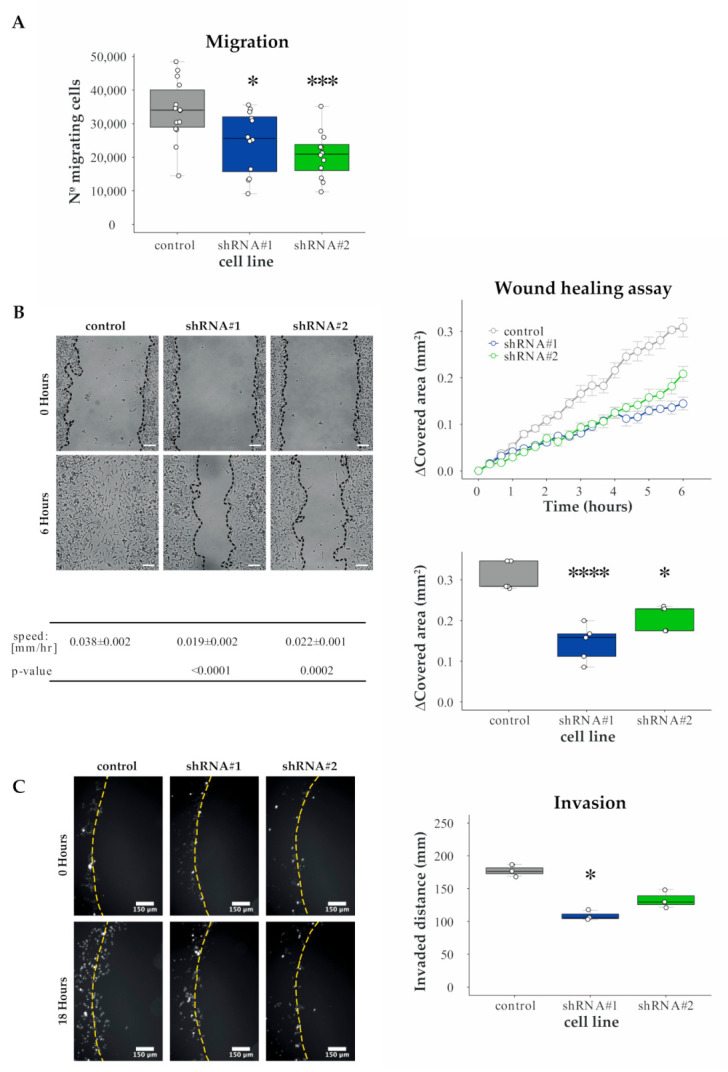
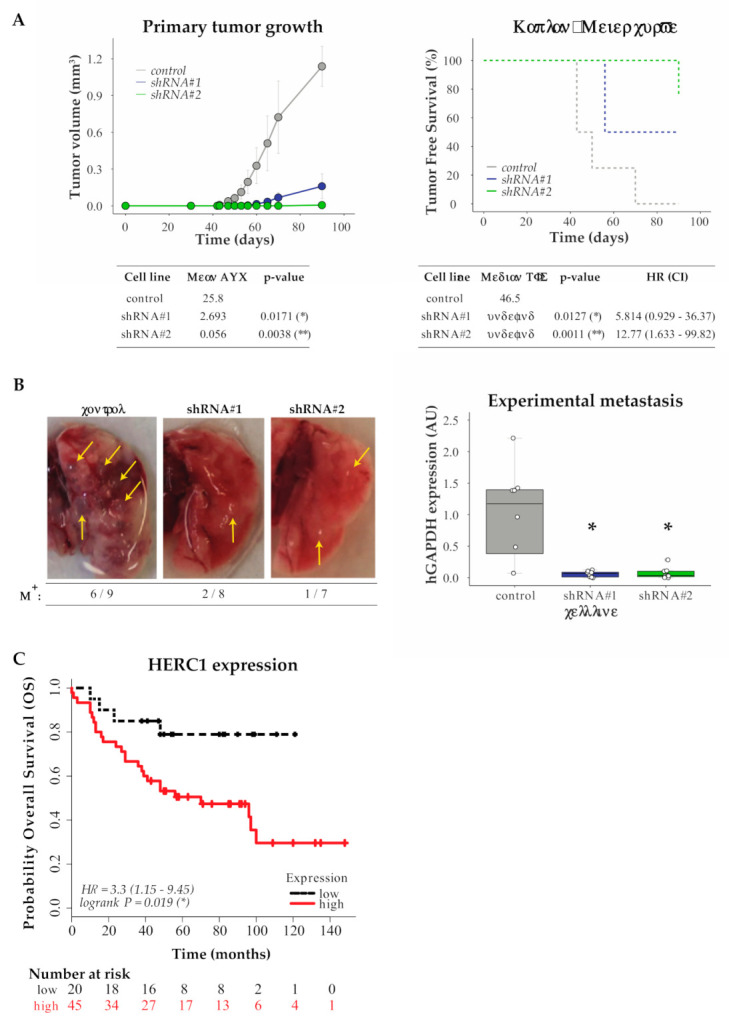
Tumor cell migration and invasion into adjacent tissues is one of the hallmarks of cancer and the first step towards secondary tumors formation, which represents the leading cause of cancer-related deaths. This process is considered an unmet clinical need in the treatment of this disease, particularly in breast cancers characterized by high aggressiveness and metastatic potential. To identify and characterize genes with novel functions as regulators of tumor cell migration and invasion, we performed a genetic loss-of-function screen using a shRNA library directed against the Ubiquitin Proteasome System (UPS) in a highly invasive breast cancer derived cell line. Among the candidates, we validated HERC1 as a gene regulating cell migration and invasion. Furthermore, using animal models, our results indicate that HERC1 silencing affects primary tumor growth and lung colonization. Finally, we conducted an in silico analysis using publicly available protein expression data and observed an inverse correlation between HERC1 expression levels and breast cancer patients' overall survival. Altogether, our findings demonstrate that HERC1 might represent a novel therapeutic target for the development or improvement of breast cancer treatment.

Keywords: HERC1; breast; cancer; invasion; target.


Conflict of interest statement

The authors declare no conflict of interest.

Figures

Figure 1
Figure 1
shRNA-based selection of positive regulators of cell migration. (A) Overview of the selection procedure. The production and infection of an ubiquitylation-related lentiviral shRNA library are described in Methods. Two weeks after lentiviral infection and selection, MDA-MB-231 cells were seeded onto Boyden chamber inserts and allowed to migrate across the porous membrane at 37 °C for 24 h in order to select cells with a decreased migration phenotype. Migrating cells were removed and non-migrating cells were collected by trypsin treatment from the inserts upper compartment and cultivated for one week. Cells were then reseeded onto Boyden chamber culture inserts for a subsequent round of selection; this procedure was repeated until cells lost 75% of their initial migratory potential. This non-migratory population of cells was then inoculated through tail vein injection into NOD/SCID mice, and primary cultures were generated after two months from lung and brain tissues. shRNAs were retrieved by PCR from the in vitro and in vitro/vivo-selected cells, and then identified by Next Generation Sequencing (NGS). (B) Boyden chamber assay was used every other enrichment cycle to determine the relative percentage of migratory cells and monitor the selection process. (C) shRNAs abundance after the in vivo selection, relative to their abundance in the in vitro-selected non-migratory cells.
Figure 2
Figure 2
Proliferation is unaffected by HERC1 depletion. MDA-MB-231 cells were stably transduced with an empty vector (control) or two different shRNAs (#1 and #2) targeting HERC1. (A) Efficiencies of shRNA-mediated target gene knockdown were confirmed by RT-PCR (top, n = 7, one-way ANOVA, Dunnett’s multiple comparison test; shRNA #1 p = 0.0014 (**) and shRNA #2 p = 0.0365 (*)). (B) An area-based microscopy method was used to determine cell growth over time. Cells were seeded onto wells and allowed to attach. At the indicated time points, cells were photographed, and the occupied area was calculated. The graph shows the occupied area relative to time = 0 h. Doubling times = control, 47.01 ± 0.2087; shRNA #1, 46.23 ± 0.3667; shRNA #2, 47.38 ± 1.023 (n = 3, Kruskal–Wallis, Dunn’s multiple comparison test; shRNA #1 p > 0.9999 and shRNA #2 p = 0.4503). (C) Cells were subjected to colony formation assay: (Top) representative images of the crystal violet-stained 100 mm dishes at the end of the experiment; (Bottom Left) number of colonies generated after 15 days (n = 3, Kruskal–Wallis, Dunn’s multiple comparison test; shRNA #1 p > 0.9999 and shRNA #2 p = 0.4661); and (Bottom Right) diameter of the resulting colonies (n = 3, Kruskal–Wallis, Dunn’s multiple comparison test; shRNA #1 p = 0.1473 and shRNA #2 p > 0.9999).
Figure 3
Figure 3
Validation and characterization of HERC1 as a candidate migration and invasion regulatory gene. Cells migratory potential was evaluated by two different experiments. (A) Boyden chamber assay: number of migratory cells per Boyden chamber membrane (n ≥ 12, one-way ANOVA, Dunnett’s multiple comparison test; shRNA #1 p = 0.0180 (*) and shRNA #2 p = 0.0009 (***)). (B) Wound healing assay: (Top Left) representative areas in a wound healing experiment at the indicated time points, scale bar = 100 μm; (Top Right) wound covered area (mm2) at the indicated time points; (Bottom Left) wound edge closing speed (n = 5, one-way ANOVA, Dunnett’s multiple comparison test; shRNA #1 p < 0.0001 (****) and shRNA #2 p = 0.0002 (***)); and (Bottom Right) wound covered area (mm2) at endpoint (n = 5, one-way ANOVA, Dunnett’s multiple comparison test; shRNA #1 p < 0.0001 (****) and shRNA #2 p = 0.0024 (*)). (C) Agar spot assay: cells were seeded in wells with drops of solidified agar and invaded along the bottom surface under the agar. Pictures were taken along the edge and the displacement is the extent of invasion under agar from the spot edge to cells final position: (Left) representative area showing cell invasion into an agar spot at the indicate time points, scale bar = 150 μm; and (Right) cells mean displacement at the end of the experiment (n = 3, Kruskal–Wallis, Dunn’s multiple comparison test; shRNA #1 p = 0.0146 (*) and shRNA #2 p = 0.3594).
Figure 4
Figure 4
In vivo and in silico analysis of HERC1 relevance in tumor biology and patients’ survival. (A) Downregulation of HERC1 attenuates tumorigenicity in vivo. Control or HERC1-silenced MDA-MB-231 cells were subcutaneously inoculated into the mammary fat pads of female NOD/SCID mice and tumor growth was monitored every 2–3 days: (Top Left) tumor volume was calculated at the indicated time points (results show mean value ± s.e.m.); (Bottom Left) Area Under Curve (AUC) was performed to analyze differences between treatments (n ≥ 4, Kruskal–Wallis, Dunn’s multiple comparison test; shRNA #1 p = 0.0171 (*) and shRNA #2 p = 0.0038 (**)); (Top Right) Kaplan–Meier curves for Tumor Free Survival (TFS) in mice injected with control or HERC1-silenced cells; and (Bottom Right) log-rank test (Mantel–Cox) analysis (HR, hazard ratio; CI, confidence interval) (n ≥ 4, log-rank (Mantel–Cox) test; shRNA #1 p = 0.0127 (*) and shRNA #2 p = 0.0011 (**)). (B) Silencing effects of HERC1 on experimental metastasis assays: NOD/SCID male mice were inoculated with MDA-MB-231 control or HERC1-silenced cells through tail vein injection and lungs were harvested after two months: (Left) Representative images of lungs at endpoint; metastatic foci are indicated with arrows. M+, ratio of lungs positive for metastatic growth versus the number of injected mice. (Right) Metastatic potential was estimated by qPCR human DNA quantification, normalized to mouse DNA (n = 8, Kruskal–Wallis, Dunn’s multiple comparison test; shRNA #1 p = 0.0187 (*) and shRNA #2 p = 0.0136 (*)). (C) Kaplan–Meier curves for breast carcinoma patients’ Overall Survival (OS) according to HERC1 protein expression status in primary tumors: red solid line and black dashed line indicate cases with high and low expression of HERC1, respectively (n =65, Log-Rank (Mantel–Cox) test, p = 0.019 (*)).

References

    1. Gupta G.P., Massagué J. Cancer Metastasis: Building a Framework. Cell. 2006;127:679–695. doi: 10.1016/j.cell.2006.11.001. - DOI - PubMed
    1. Hanahan D., Weinberg R.A. Hallmarks of Cancer: The Next Generation. Cell. 2011;144:646–674. doi: 10.1016/j.cell.2011.02.013. - DOI - PubMed
    1. Gallo L.H., Ko J., Donoghue D.J. The importance of regulatory ubiquitination in cancer and metastasis. Cell Cycle. 2017;16:634–648. doi: 10.1080/15384101.2017.1288326. - DOI - PMC - PubMed
    1. Deshaies R.J. Proteotoxic crisis, the ubiquitin-proteasome system, and cancer therapy. BMC Biol. 2014;12:94. doi: 10.1186/s12915-014-0094-0. - DOI - PMC - PubMed
    1. Ciechanover A. The ubiquitin proteolytic system: From a vague idea, through basic mechanisms, and onto human diseases and drug targeting. Neurology. 2005;66:S7–S19. doi: 10.1212/01.wnl.0000192261.02023.b8. - DOI - PubMed

LinkOut - more resources