. 2021 Mar 15;18(6):3011.
doi: 10.3390/ijerph18063011.

Effect of a Simulated Heat Wave on Physiological Strain and Labour Productivity

Affiliations

Effect of a Simulated Heat Wave on Physiological Strain and Labour Productivity

Leonidas G Ioannou et al. Int J Environ Res Public Health. .

Abstract

Background: The aim of the study was to investigate the effect of a simulated heat-wave on the labour productivity and physiological strain experienced by workers.

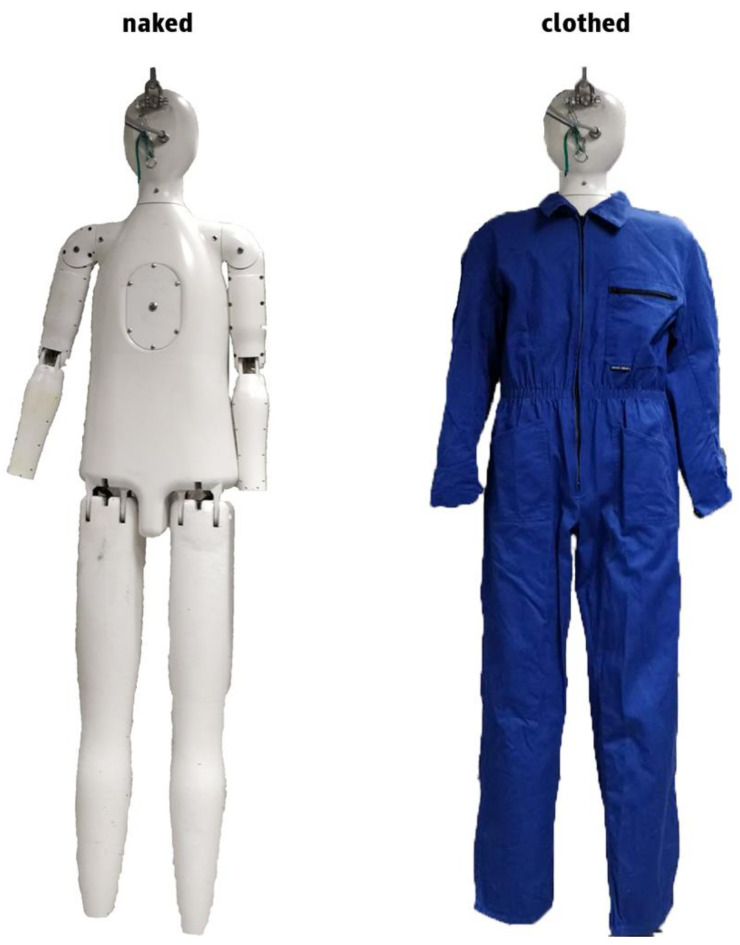
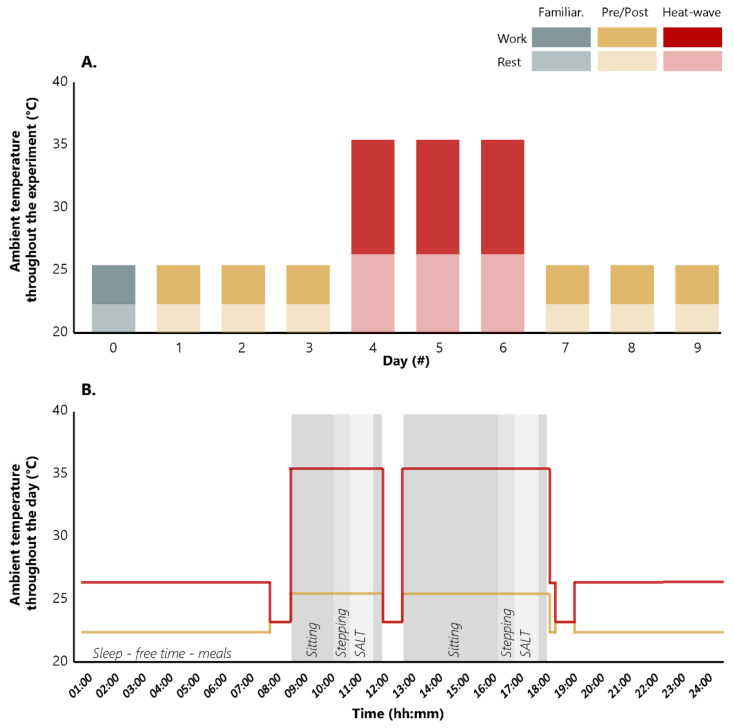
Methods: Seven males were confined for ten days in controlled ambient conditions. A familiarisation day was followed by three (pre, during, and post-heat-wave) 3-day periods. During each day volunteers participated in a simulated work-shift incorporating two physical activity sessions each followed by a session of assembly line task. Conditions were hot (work: 35.4 °C; rest: 26.3 °C) during, and temperate (work: 25.4 °C; rest: 22.3 °C) pre and post the simulated heat-wave. Physiological, biological, behavioural, and subjective data were collected throughout the study.

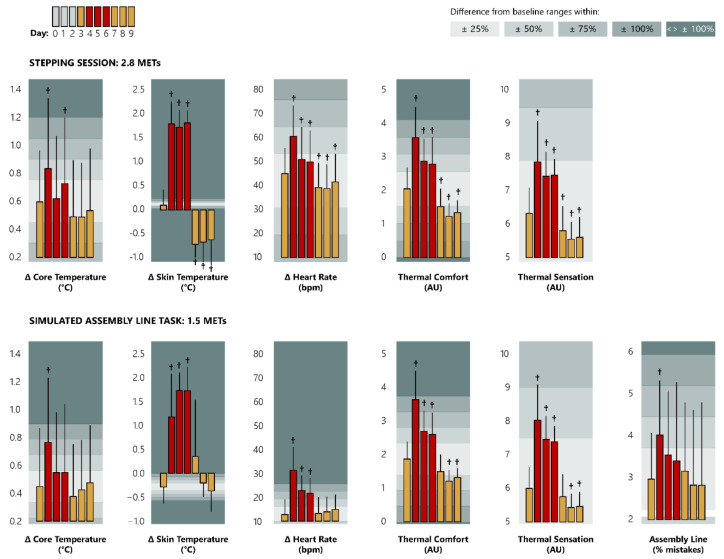
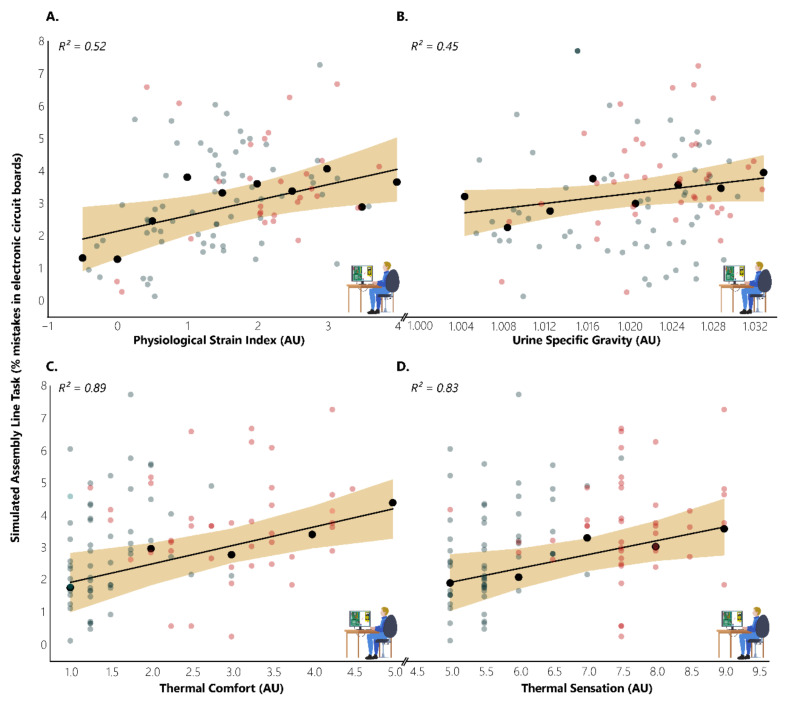
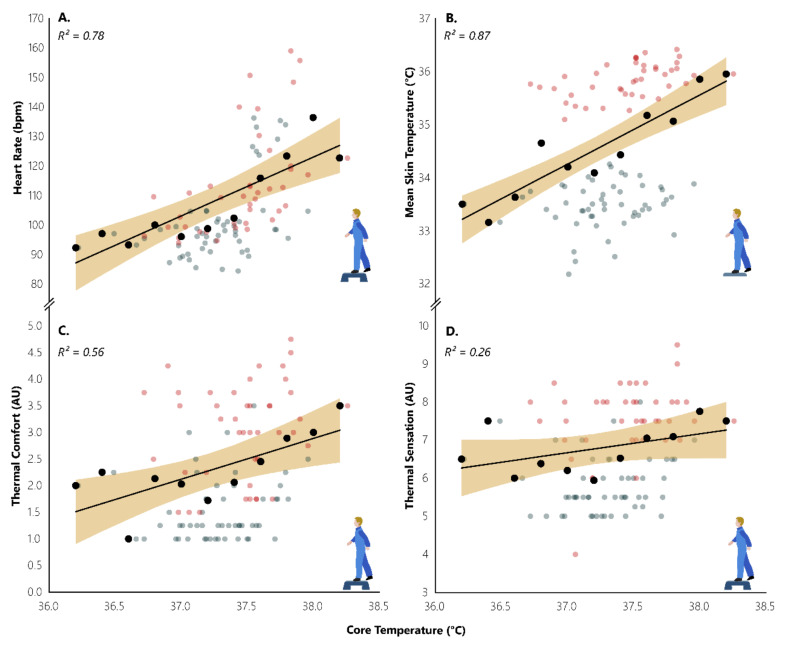
Results: The simulated heat-wave undermined human capacity for work by increasing the number of mistakes committed, time spent on unplanned breaks, and the physiological strain experienced by the participants. Early adaptations were able to mitigate the observed implications on the second and third days of the heat-wave, as well as impacting positively on the post-heat-wave period.

Conclusions: Here, we show for first time that a controlled simulated heat-wave increases workers' physiological strain and reduces labour productivity on the first day, but it promotes adaptations mitigating the observed implications during the subsequent days.

Keywords: assembly line; core temperature; heart rate; heat; heat stress; hot; occupation; skin temperature; thermal stress; work.


Conflict of interest statement

The authors declare no conflict of interest. The funder had no role in study design, data collection and analysis, decision to publish, or preparation of the manuscript.

Figures

Figure A1
Figure A1
Determining the clothing insulation of the work coveralls used in our study using a thermal manikin.
Figure A2
Figure A2
This figure depicts the software-generated printed circuit board (left panel) and multimeter (right panel) used in our simulated assembly line task. Using the movable red probe (shown on the circuit board), participants were required to test the values of resistances, by placing the tool on the orange circles. The values of the resistance were displayed on the multimeter. Based on the values of the resistances, participants have several options, as described in the text. The software is freely available after contacting the corresponding author.
Figure A3
Figure A3
Simulated assembly line task being conducted during the heat-wave.
Figure 1
Figure 1
Fluctuation of simulated ambient temperatures throughout the experiment (A) and throughout the day (B). Turquoise, yellow, and red bars represent familiarisation day, pre/post, and during heat-wave periods, respectively. Dark and light colours correspond to the simulated ambient temperatures during work and rest, respectively. Lines represent the two levels (work and rest) of heat stress during (red) and pre/post (yellow) the simulated heat-wave. Work-shifts were scheduled between 08:40 and 18:00. A strict time-framed (wake up: 07:00, breakfast: 08:00, work: 08:40–12:00, lunch: 12:00, work: 12:40–18:00, dinner: 18:20, free time: 19:00–23:00, and sleep: 23:00) protocol was followed. The time periods spent on passive heat exposure (i.e., sitting in the workplace without having work to perform; duration, 5:20), simulated assembly line tasks (SALT; 2 × 60 min), and stepping sessions (2 × 40 min) are distinguished by different shades of grey. The remaining time was dedicated for meals, free time, and sleep in controlled environmental conditions.
Figure 2
Figure 2
Ambient conditions during the day prior to the heat-wave (left) and the first day of the heat-wave (right). All pictures were taken using the same thermal camera set to be sensitive within a range of 19.9 and 40.0 °C.
Figure 3
Figure 3
Differences (means ± sd) in thermal strain and labour efficiency during stepping (top graph) and simulated assembly line task (bottom graph) between neutral and hot days. Data are presented as delta (Δ) differences from the pre-heat-wave sleep (sleep time of days 0–2), depicting the increase/decrease in the physiological strain experienced by our participants. Yellow and red bars correspond to the days pre-/post and during the heat-wave, respectively. The first yellow bar (day: 3) represents the average of each variable across the pre-heat-wave period (days 1–3). Grey areas in the background represent the magnitude (%) of difference compared to the pre-heat-wave variables. AU indicates arbitrary units. Cross signs indicate statistically significant differences compared to the pre-heat-wave period, at p < 0.05.
Figure 4
Figure 4
Impacts of physiological strain (A), hydration status (B), thermal comfort (C), and thermal sensation (D) on labour productivity, as expressed by physiological strain index, urine specific gravity, and the subjective scales of thermal comfort and thermal sensation, respectively. AU indicates arbitrary units. Red and blue dots represent work during hot (35.4 °C) and neutral (25.4 °C) conditions, respectively. Black dots with their accompanied trendline and 95% CI (shaded area) depict the increase in the number of mistakes committed in electronic circuit boards for every 0.5 points in physiological strain index, 0.004 points in the urine specific gravity scale, and 1 point in the subjective scales of thermal comfort and thermal sensation.
Figure 5
Figure 5
Impacts of core temperature on heart rate (A), mean skin temperature (B), thermal comfort (C), and thermal sensation (D). AU indicates arbitrary units. Red and blue dots represent work during hot (35.4 °C) and neutral (25.4 °C) conditions, respectively. Black dots with their accompanied trendline and 95% CI (shaded area) depict the increase in core temperature for every 20-bpm heart rate, 1 °C mean skin temperature, and 1 point in the subjective scales of thermal comfort and thermal sensation.

References

    1. World Health Organisation . World Health Assembly resolution WHA60.26, “Workers’ Health: Global Plan of Action”. World Health Organisation; Geneva, Switzerland: 2007.
    1. Flouris A.D., Ioannou L.G., Dinas P.C., Mantzios K., Gkiata P., Gkikas G., Vliora M., Amorim T., Tsoutsoubi L., Kapnia A., et al. Assessment of Occupational Heat Strain and Mitigation Strategies in Qatar—Summary of Key Findings. International Labour Organization; Geneva, Switzerland: 2019.
    1. Nybo L., Kjellstrom T., Bogataj L.K., Flouris A.D. Global heating: Attention is not enough; we need acute and appropriate actions. Temperature. 2017;4:199–201. doi: 10.1080/23328940.2017.1338930. - DOI - PMC - PubMed
    1. Perkins S., Alexander L., Nairn J. Increasing frequency, intensity and duration of observed global heatwaves and warm spells. Geophys. Res. Lett. 2012:39. doi: 10.1029/2012GL053361. - DOI
    1. Morris N.B., Jay O., Flouris A.D., Casanueva A., Gao C., Foster J., Havenith G., Nybo L. Sustainable solutions to mitigate occupational heat strain—An umbrella review of physiological effects and global health perspectives. Environ. Health. 2020;19:1–24. doi: 10.1186/s12940-020-00641-7. - DOI - PMC - PubMed

Publication types

LinkOut - more resources