. 2021 Mar 15;11(3):431.
doi: 10.3390/biom11030431.

Leptin Is Associated with Poor Clinical Outcomes and Promotes Clear Cell Renal Cell Carcinoma Progression

Affiliations

Leptin Is Associated with Poor Clinical Outcomes and Promotes Clear Cell Renal Cell Carcinoma Progression

Wen-Lang Fan et al. Biomolecules. .

Abstract

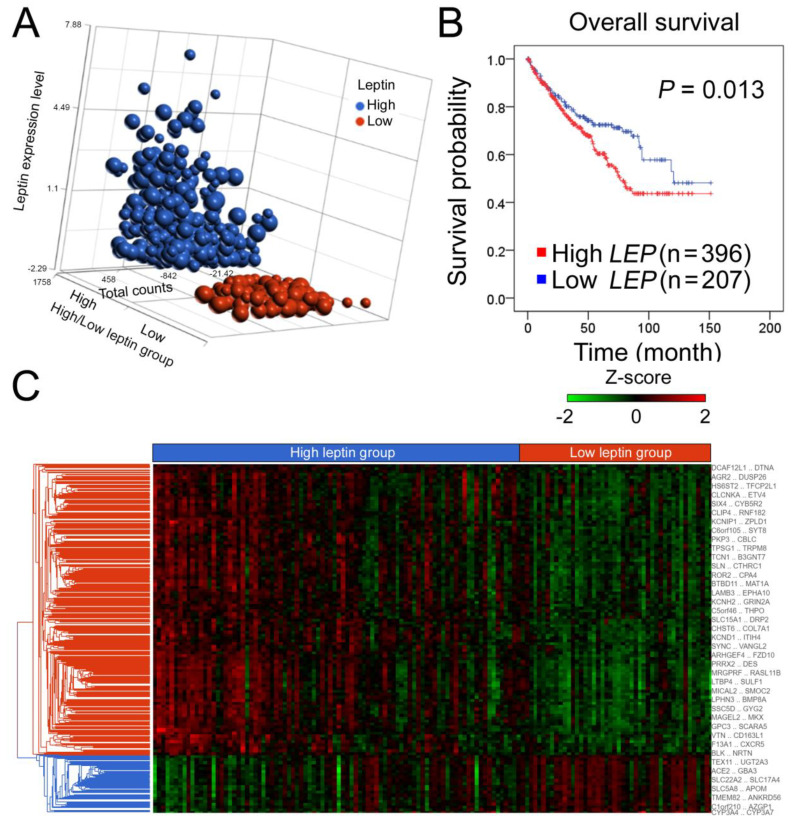
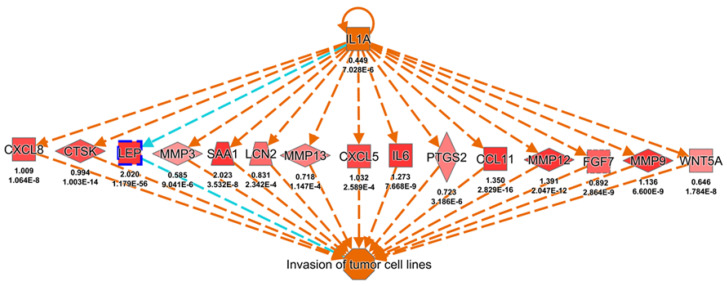
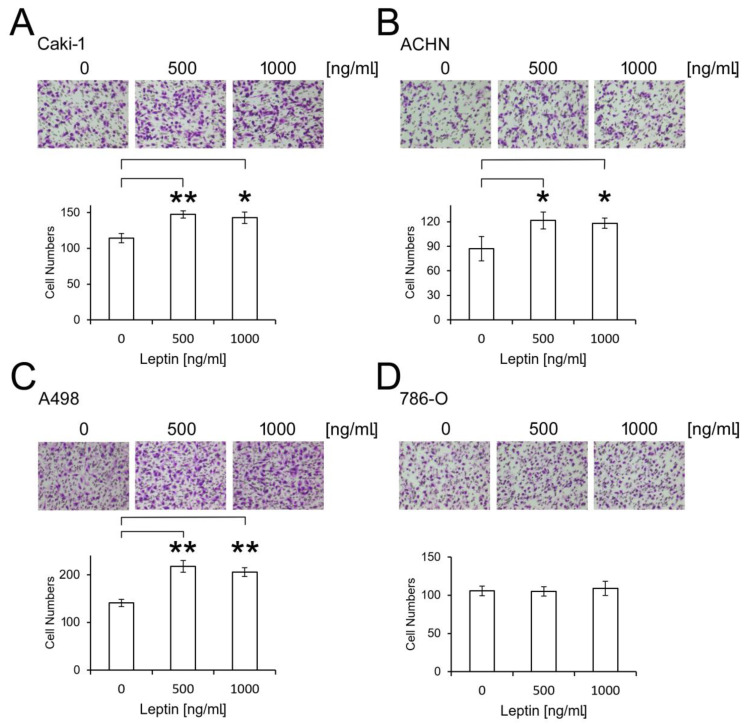
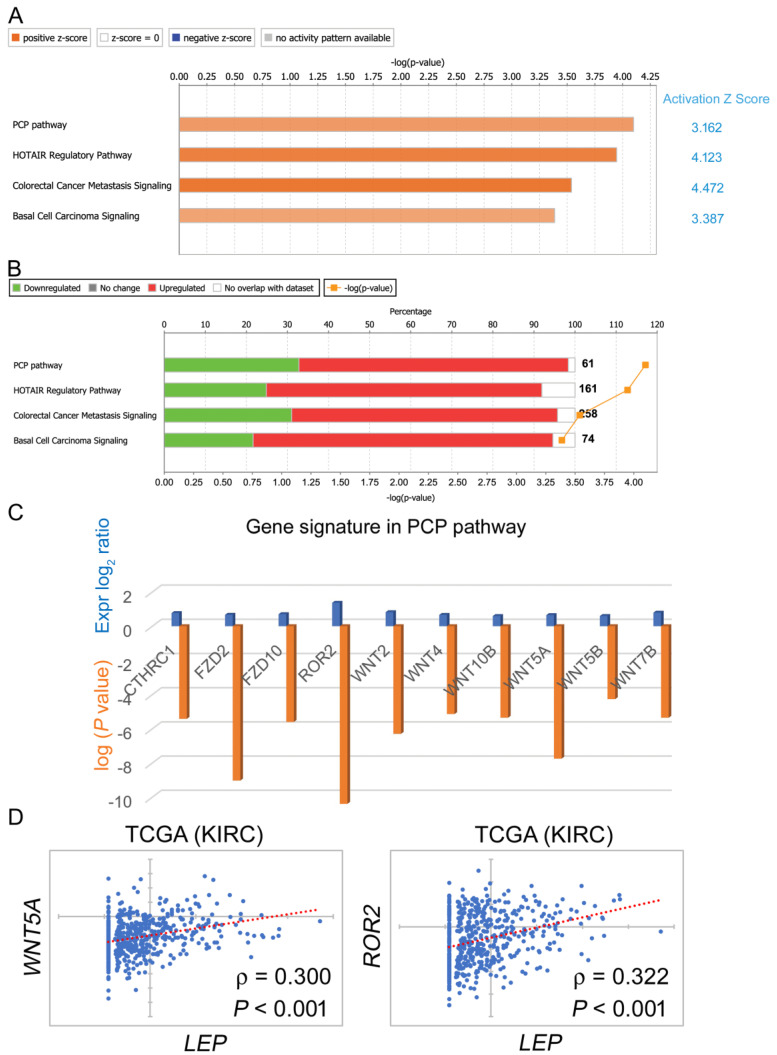
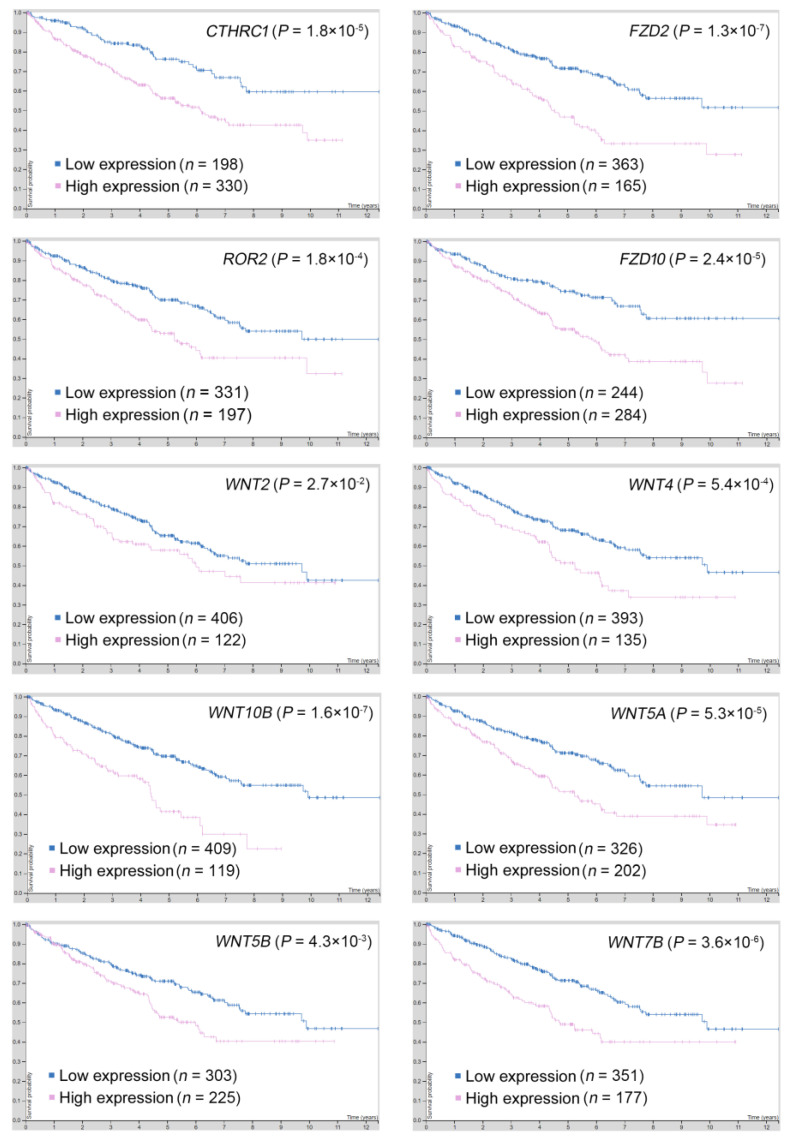
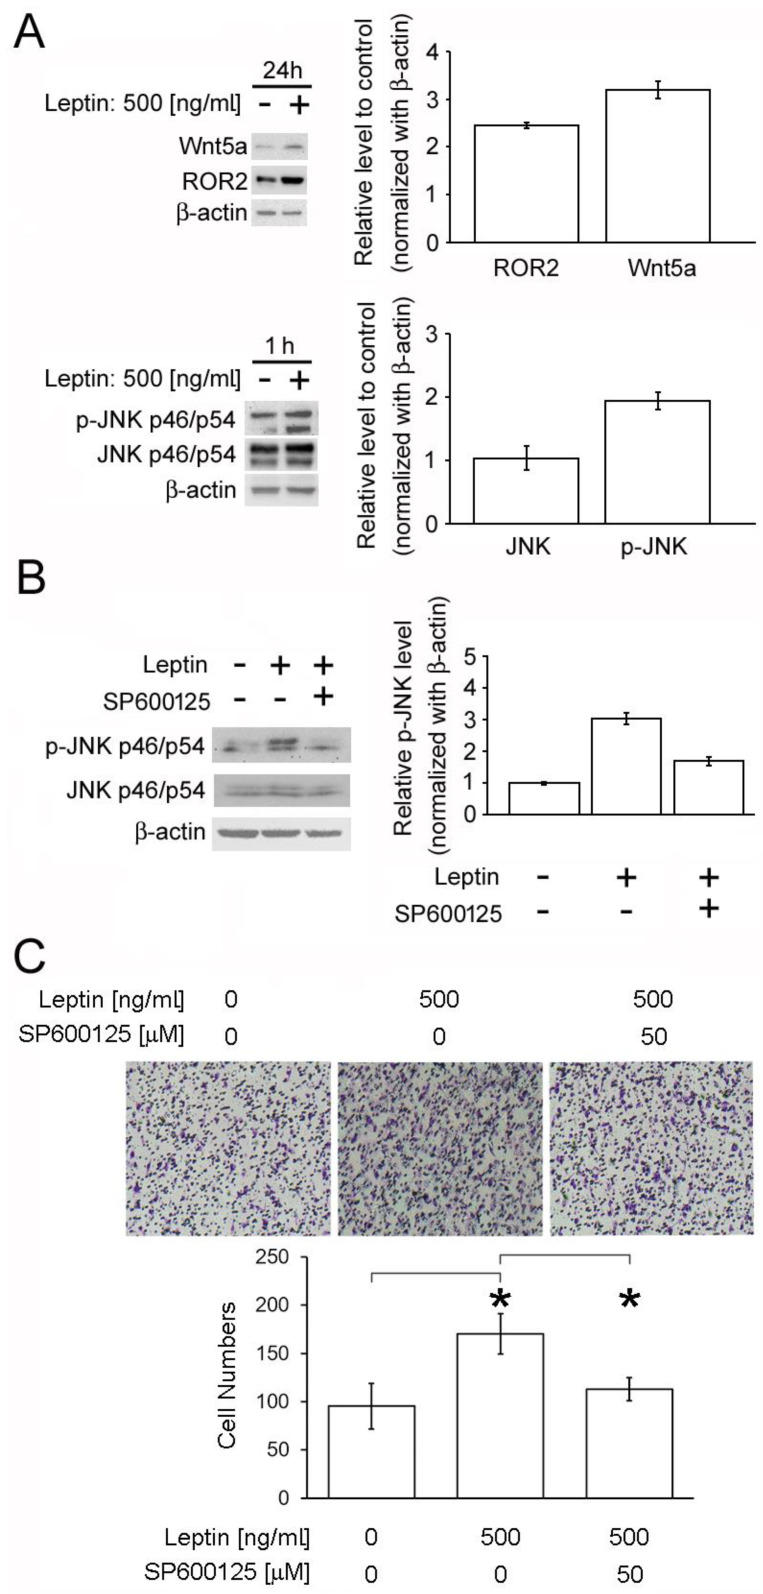
Emerging evidence has shown the oncogenic roles of leptin in modulating cancer progression in addition to its original roles. Analyses of transcriptomic data and patients' clinical information have revealed leptin's prognostic significance in renal cell carcinoma (RCC). However, its biological effects on RCC progression have not yet been explored. Clinical and transcriptomic data of a RCC cohort of 603 patients were retrieved from The Cancer Genome Atlas (TCGA) and analyzed to reveal the correlation of leptin with clinical outcomes and the hierarchical clustering of gene signatures based on leptin levels. In addition, cox univariate and multivariate regression analyses, cell migration upon leptin treatment, identification of putative leptin-regulated canonical pathways via ingenuity pathway analysis (IPA), and the investigation of induction of Wnt5a, ROR2, and Jun N-terminal Kinases (JNK) phosphorylation activation were performed. We first observed a correlation of high leptin levels and poor outcomes in RCC patients. Knowledge-based analysis by IPA indicated the induction of cancer cell migration by leptin, which was manifested via direct leptin treatment in the RCC cell lines. In RCC patients with high leptin levels, the planar cell polarity (PCP)/JNK signaling pathway was shown to be activated, and genes in the axis, including CTHRC1, FZD2, FZD10, ROR2, WNT2, WNT4, WNT10B, WNT5A, WNT5B, and WNT7B, were upregulated. All of these genes were associated with unfavorable clinical outcomes. WNT5A and ROR2 are pivotal upstream regulators of PCP/JNK signaling, and their correlations with leptin expression levels were displayed by a Pearson correlation analysis. The inhibition of signal transduction by SP600125 reversed leptin-mediated cell migration properties in RCC cell lines. The results indicate the prognostic impact of leptin on RCC patients and uncover its ability to promote cell migration via PCP/JNK signaling.

Keywords: clinical outcome; leptin; renal cell carcinoma.


Conflict of interest statement

The authors declare no conflict of interest. The funders had no role in the design of the study; collection, analyses, or interpretation of data; writing of the manuscript; or decision to publish the results.

Figures

Figure 1
Figure 1
Correlation of leptin with clinical outcomes and hierarchical clustering of gene signatures based on leptin levels. The gene expression profile in the dataset of kidney renal clear cell carcinoma (KIRC) (dataset ID: Table 2. PANCAN) was determined by RNA-Seq platform (Illumina HiSeq). (A) Relative leptin and transcriptomic read counts (total counts) of clear cell renal cell carcinoma (ccRCC) patients in the leptin high/low groups; 603 cases were stratified to 396 cases in high-leptin group and 207 cases in low-leptin group. Size of dot indicates the relative case number of patients. (B) Kaplan–Meier analysis of leptin expression under the condition of overall survival probability in ccRCC patients. (C) Hierarchical clustering of genes in the high and low leptin groups. Z-scores were computed on a gene-by-gene basis by subtracting the mean and then dividing by the standard deviation.
Figure 2
Figure 2
Transcriptomic alteration-based identification of potential diseases and functions modulated upon leptin upregulation. A total of 20,530 gene expression data from each ccRCC patient were retrieved from The Cancer Genome Atlas TCGA. The differential gene signatures were obtained after comparing each gene in the high leptin group to each gene in the low leptin group. Gene targets were further filtered by the log2-transformed 1.5-fold change and p value (<0.05) for ingenuity pathway analysis (IPA) (938 gene targets). The putative regulatory network of the top diseases and functions is presented. E: e notation indicated “× 10n” of a value m × 10n.
Figure 3
Figure 3
Investigation of ccRCC cell migration upon leptin treatment. Leptin (500 and 1000 ng/mL) was added to the ccRCC cell lines Caki-1 (A), ACHN (B), A498 (C), and 786-O (D) for 24 h. Cancer cell migration ability was then evaluated by transwell assays. The experiments were performed three times and a representative result is shown. The p values at the following levels were considered significant: * p < 0.05, ** p < 0.01.
Figure 4
Figure 4
List of putative leptin-regulated canonical pathways via IPA. (A) The differentially expressed gene targets in the high leptin group were studied in the IPA platform. Pivotal canonical pathways judged by the levels of gene expression and numbers of target overlapping with the IPA database are shown along with the activation status judged by the z-score. (B) The distribution of up- and downregulated gene targets in each canonical pathway, (C) gene targets characterized with the significant expressional alterations in the PCP signaling pathway, and (D) Pearson correlations of WNT5A and ROR2 with LEP in the TCGA ccRCC cohort.
Figure 5
Figure 5
Prognostic significance of PCP pathway gene targets in the ccRCC cohort. The prognostic significance in predicting overall survival was shown after stratifying RNA levels of the indicated genes in the ccRCC cohort (TCGA). The clinical and transcriptomic data of ccRCC patients were obtained from The Pathology Atlas database (https://www.proteinatlas.org/; accessed on 15 January 2021).
Figure 6
Figure 6
Induction of JNK phosphorylation activation and cell migration by leptin. (A) ACHN cells were treated with 500 ng/mL leptin for 1 and 24 h. The p-JNK at p46 and p54 isoforms and Wnt5a and ROR2 levels were detected by Western blot. (B) ACHN cells were pretreated with 50 μM SP600125 (a JNK inhibitor) for 30 min prior to 1 h of leptin incubation. Relative p-JNK level was evaluated by Western blot. (C) ACHN cells were pretreated with 50 μM SP600125 (a JNK inhibitor) for 30 min prior to 24 h of leptin incubation. Cell migration ability was measured by transwell assays. The experiments were performed three times and a representative result is shown. The p values at the following levels were considered significant: * p < 0.05.

References

    1. Lin T.C., Huang K.W., Liu C.W., Chang Y.C., Lin W.M., Yang T.Y., Hsiao M. Leptin signaling axis specifically associates with clinical prognosis and is multifunctional in regulating cancer progression. Oncotarget. 2018;9:17210–17219. doi: 10.18632/oncotarget.24966. - DOI - PMC - PubMed
    1. Zhang Y., Proenca R., Maffei M., Barone M., Leopold L., Friedman J.M. Positional cloning of the mouse obese gene and its human homologue. Nat. Cell Biol. 1994;372:425–432. doi: 10.1038/372425a0. - DOI - PubMed
    1. Tartaglia L.A., Dembski M., Weng X., Deng N., Culpepper J., Devos R., Richards G.J., Campfield L., Clark F.T., Deeds J., et al. Identification and expression cloning of a leptin receptor, OB-R. Cell. 1995;83:1263–1271. doi: 10.1016/0092-8674(95)90151-5. - DOI - PubMed
    1. Halaas J.L., Gajiwala K.S., Maffei M., Cohen S.L., Chait B.T., Rabinowitz D., Lallone R.L., Burley S.K., Friedman J.M. Weight-reducing effects of the plasma protein encoded by the obese gene. Science. 1995;269:543–546. doi: 10.1126/science.7624777. - DOI - PubMed
    1. Señarís R., Garcia-Caballero T., Casabiell X., Gallego R., Castro R., Considine R.V., Diéguez C., Casanueva F.F. Synthesis of Leptin in Human Placenta. Endocrinololgy. 1997;138:4501–4504. doi: 10.1210/endo.138.10.5573. - DOI - PubMed

Publication types

MeSH terms