. 2021 Mar 1;13(5):1013.
doi: 10.3390/cancers13051013.

Identification of Novel Transcriptome Signature as a Potential Prognostic Biomarker for Anti-Angiogenic Therapy in Glioblastoma Multiforme

Affiliations

Identification of Novel Transcriptome Signature as a Potential Prognostic Biomarker for Anti-Angiogenic Therapy in Glioblastoma Multiforme

Shuhua Zheng et al. Cancers (Basel). .

Abstract

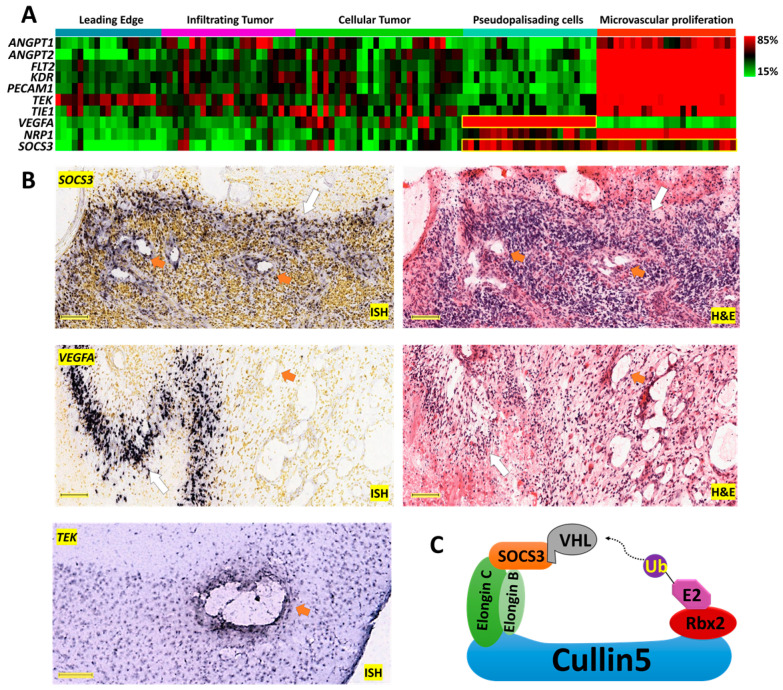
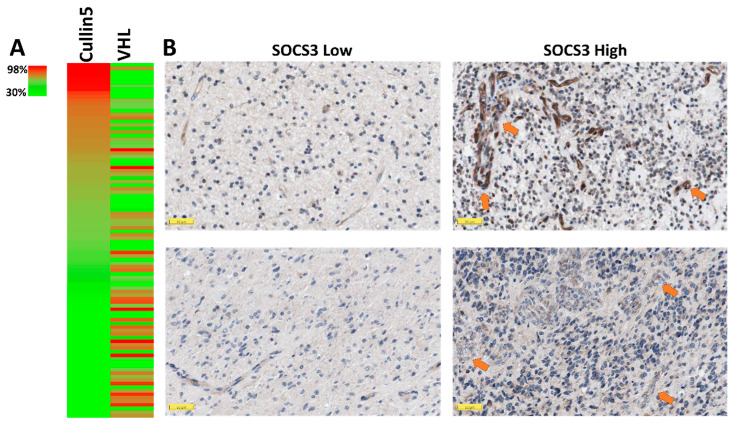
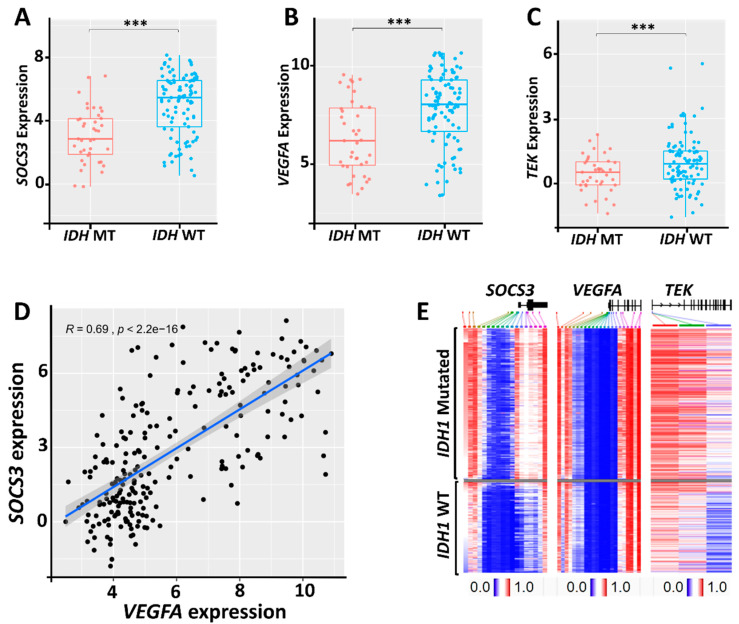
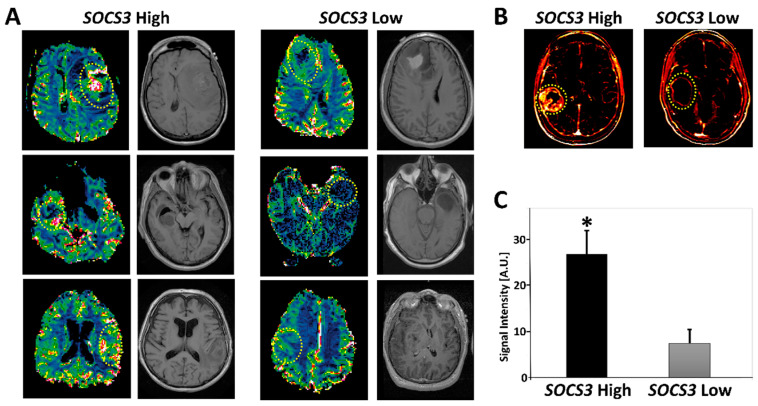
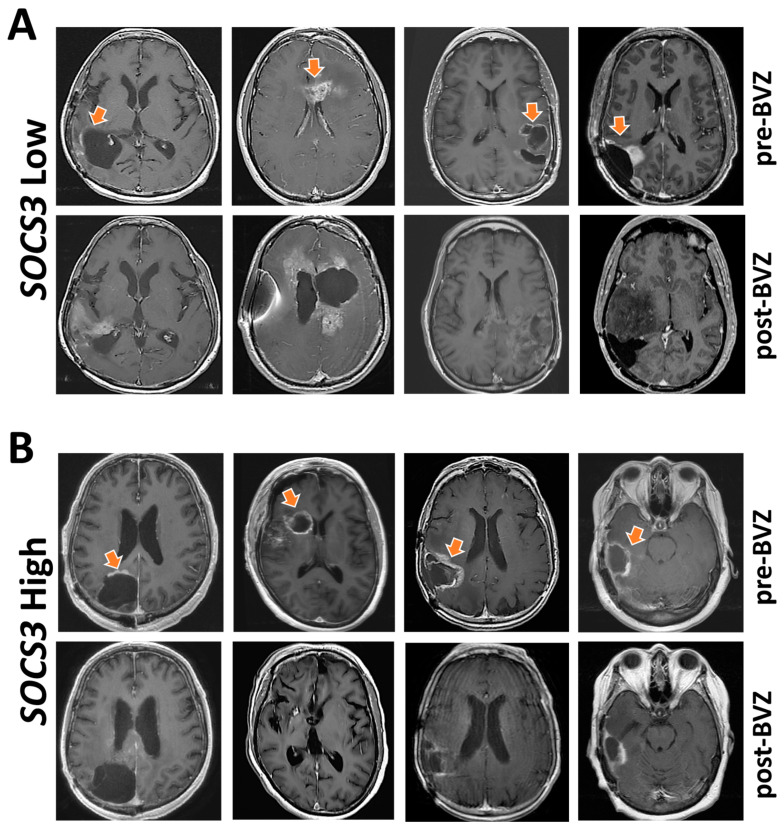
Glioblastoma multiforme (GBM) is the most common and devastating type of primary brain tumor, with a median survival time of only 15 months. Having a clinically applicable genetic biomarker would lead to a paradigm shift in precise diagnosis, personalized therapeutic decisions, and prognostic prediction for GBM. Radiogenomic profiling connecting radiological imaging features with molecular alterations will offer a noninvasive method for genomic studies of GBM. To this end, we analyzed over 3800 glioma and GBM cases across four independent datasets. The Chinese Glioma Genome Atlas (CGGA) and The Cancer Genome Atlas (TCGA) databases were employed for RNA-Seq analysis, whereas the Ivy Glioblastoma Atlas Project (Ivy-GAP) and The Cancer Imaging Archive (TCIA) provided clinicopathological data. The Clinical Proteomic Tumor Analysis Consortium Glioblastoma Multiforme (CPTAC-GBM) was used for proteomic analysis. We identified a simple three-gene transcriptome signature-SOCS3, VEGFA, and TEK-that can connect GBM's overall prognosis with genes' expression and simultaneously correlate radiographical features of perfusion imaging with SOCS3 expression levels. More importantly, the rampant development of neovascularization in GBM offers a promising target for therapeutic intervention. However, treatment with bevacizumab failed to improve overall survival. We identified SOCS3 expression levels as a potential selection marker for patients who may benefit from early initiation of angiogenesis inhibitors.

Keywords: SOCS3; VEGFA; angiogenesis; bevacizumab; glioblastoma multiforme.


Conflict of interest statement

The authors declare no conflict of interest.

Figures

Figure 1
Figure 1
Anatomical mapping of SOCS3 and angiogenic genes in glioblastoma (GBM) clinical samples. (A) Expression levels of angiogenesis markers ANGPT1, ANGPT2, FLT1, PECAM1, TEK, TIE1, VEGFA, NRP1, and KDR are mapped on corresponding anatomical structures. The yellow squares highlight the anatomical expression patterns of VEGFA and SOCS3. (B) In situ hybridization (ISH) and hematoxylin and eosin (H&E) analysis of SOCS3 and VEGFA in GBM patients, Scale bar: 200 μM. ISH analysis of TEK in normal murine cranial tissue. Scale bar: 150 μM. Image credit: Ivy-GAP, Allen Institute. Orange arrows indicate blood vessels. White arrows indicate pseudopalisading cells around necrosis. (C) Schematic overview of the CRL5 E3 ligase. SOCS3 in the CRL5 can recruit von Hippel–Lindau (VHL) for polyubiquitination and degradation.
Figure 2
Figure 2
Clinicopathological study of SOCS3 protein in GBM. (A) Heatmap analysis of proteins cullin5 and VHL in GBM. (B) Immunohistochemistry staining for SOCS3 in 4 GBM cases. Arrows indicate blood vessels. Image credit: Human Protein Atlas. Scale bar: 50 μM.
Figure 3
Figure 3
Survival analysis based on the impact of the multi-gene prognostic index (PI). (A) Heatmap analysis of expression levels of SOCS3, VEGFA, and TEK was conducted on the UCSC Xena platform based on The Cancer Genome Atlas (TCGA)-GBM dataset (n = 197). (B) Survival analysis based on hazard ratio (HR) was conducted via the GBM-BioDP (https://gbm-biodp.nci.nih.gov/). GBM was classified into proneural (P), neural (N), classical (C), and mesenchymal (M) subtypes based on gene expression patterns [20]. The stratification of the three-gene signatures for full cohort, P, M, and C subclasses is based on increasing PI levels of 1Half vs. 2Half; N subclass is based on 1Qt vs. 4Qt for stratification. *: p < 0.05; **: p < 0.01; ***: p < 0.001.
Figure 4
Figure 4
Correlation of SOCS3 and angiogenic genes’ expression levels with IDH mutation status. (AC) Expression levels of corresponding genes in IDHs mutated (MT) and IDHs wildtype (WT) GBM. (D) Pearson correlation analysis of VEGFA and SOCS3 expression in primary glioma. (E) Heatmap analysis of SOCS3, TEK, and VEGFA genes’ methylation with IDH1 mutation status based on TCGA-LGG/GBM dataset. Gray area indicates cases with methylation data that are not available. ***: p < 0.001.
Figure 5
Figure 5
Radiogenomics of SOCS3 expression in GBM. (A) Representative dynamic susceptibility contrast-MRI (DSC-MRI) images with higher than the median SOCS3 expression and lower than the median SOCS3 levels. Circles represent regions of interest (ROIs). (B) Dynamic contrast-enhanced (DCE)-MRIs of higher than the median (TCGA-06-5412) and lower than the median (TCGA-06-2570) SOCS3 expressions. (C) Quantification of 3D tumor volume perfusion intensity in groups with differential SOCS3 expression levels. *: p < 0.05.
Figure 6
Figure 6
SOCS3 expression levels and angiogenesis inhibition. Eight patients were selected from the Ivy Glioblastoma Atlas Project (Ivy-GAP) dataset. (A) Four patients who had average SOCS3 expression Z-scores > 0 were considered as a SOCS3 High expression group. (B) Another group of four patients with SOCS3 expression Z-scores < 0 were identified as a SOCS3 Low expression group. T1 post-Gad MRI images were studied before and after BVZ treatment. Each patient received at least two doses of BVZ. Orange arrows indicate radiological features related to GBM progression that decreased post-BVZ treatment in the SOCS3 High expression group.

References

    1. Gwak H.S., Yee G.T., Park C.K., Kim J.W., Hong Y.K., Kang S.G., Kim J.H., Seol H.J., Jung T.Y., Chang J.H., et al. Temozolomide salvage chemotherapy for recurrent anaplastic oligodendroglioma and oligo-astrocytoma. J. Korean Neurosurg. Soc. 2013;54:489–495. doi: 10.3340/jkns.2013.54.6.489. - DOI - PMC - PubMed
    1. Ostrom Q.T., Cioffi G., Gittleman H., Patil N., Waite K., Kruchko C., Barnholtz-Sloan J.S. CBTRUS Statistical Report: Primary Brain and Other Central Nervous System Tumors Diagnosed in the United States in 2012–2016. Neuro. Oncol. 2019;21:v1–v100. doi: 10.1093/neuonc/noz150. - DOI - PMC - PubMed
    1. Cancer Genome Atlas Research Network. Brat D.J., Verhaak R.G., Aldape K.D., Yung W.K., Salama S.R., Cooper L.A., Rheinbay E., Miller C.R., Vitucci M., et al. Comprehensive, Integrative Genomic Analysis of Diffuse Lower-Grade Gliomas. N. Engl. J. Med. 2015;372:2481–2498. doi: 10.1056/NEJMoa1402121. - DOI - PMC - PubMed
    1. Burgenske D.M., Yang J., Decker P.A., Kollmeyer T.M., Kosel M.L., Mladek A.C., Caron A.A., Vaubel R.A., Gupta S.K., Kitange G.J., et al. Molecular profiling of long-term IDH-wildtype glioblastoma survivors. Neuro. Oncol. 2019;21:1458–1469. doi: 10.1093/neuonc/noz129. - DOI - PMC - PubMed
    1. Gao W.Z., Guo L.M., Xu T.Q., Yin Y.H., Jia F. Identification of a multidimensional transcriptome signature for survival prediction of postoperative glioblastoma multiforme patients. J. Transl. Med. 2018;16:368. doi: 10.1186/s12967-018-1744-8. - DOI - PMC - PubMed

LinkOut - more resources