

Short or Long Interval between Priming and Boosting: Does It Impact on the Vaccine Immunogenicity?
- PMID: 33804604
- PMCID: PMC8003773
- DOI: 10.3390/vaccines9030289
Short or Long Interval between Priming and Boosting: Does It Impact on the Vaccine Immunogenicity?
Abstract
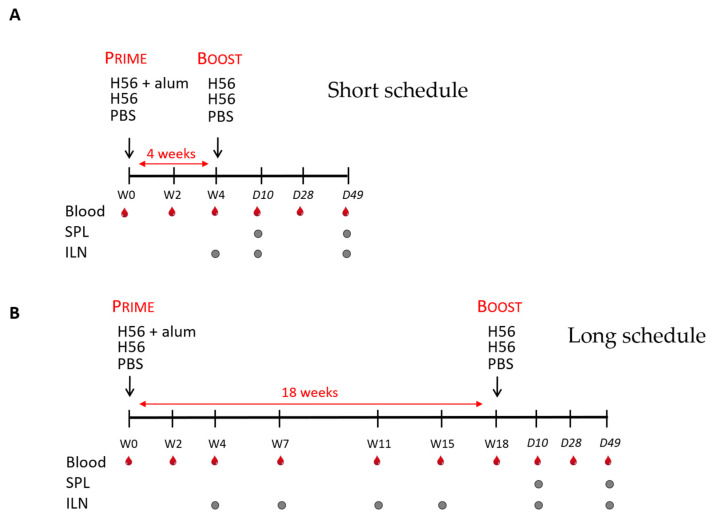
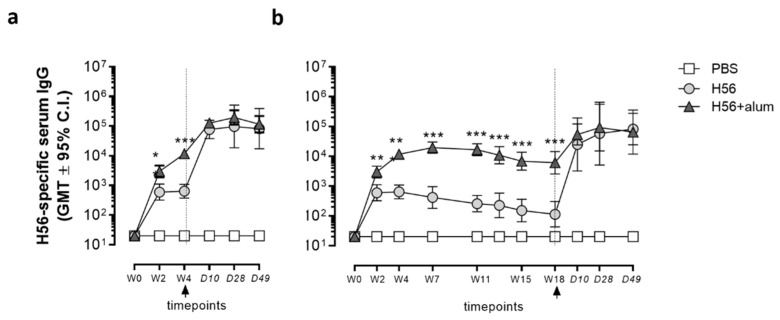
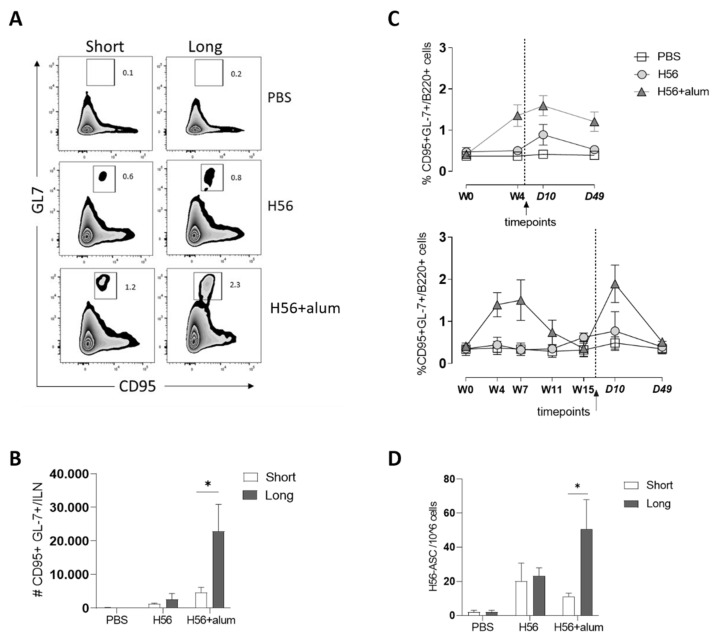
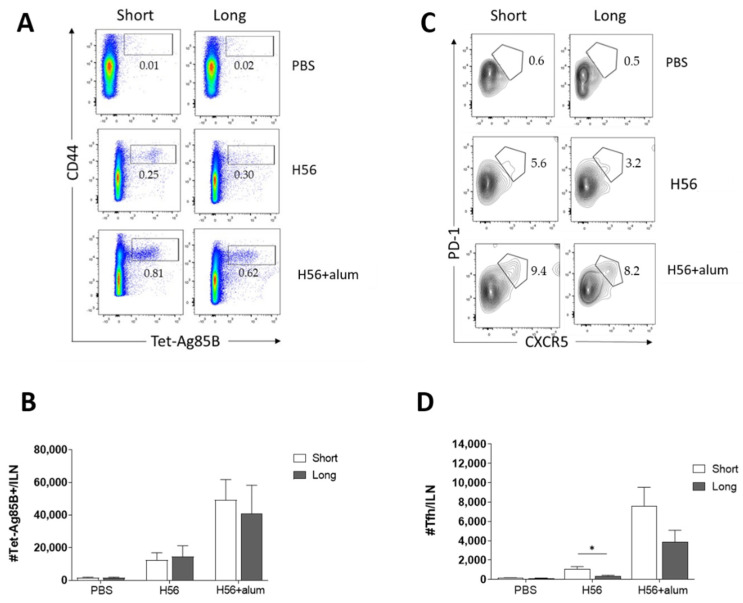
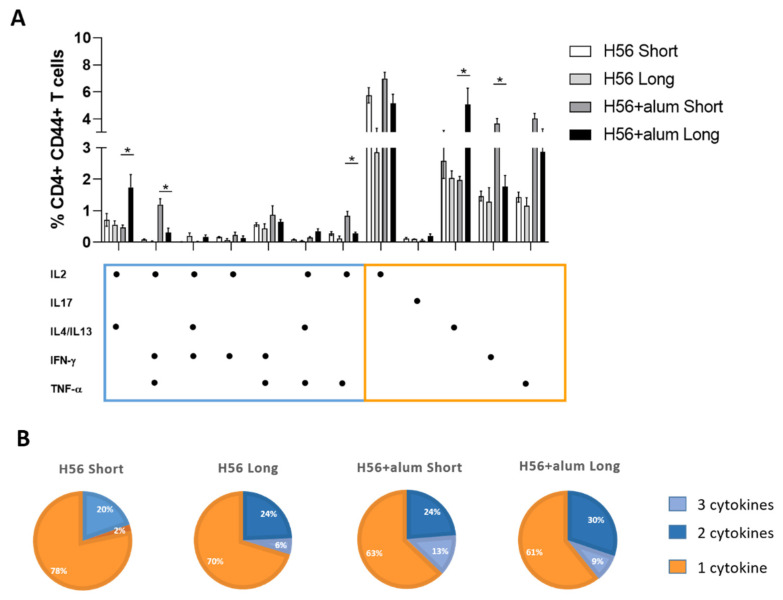
Characterizing the impact of the vaccination schedule on the induction of B and T cell immune responses is critical for improving vaccine immunogenicity. Here we compare the effect of a short (4 weeks) or a long (18 weeks) interval between priming and boosting in mice, using a model vaccine formulation based on the chimeric tuberculosis vaccine antigen H56 combined with alum. While no significant difference was observed in serum antigen-specific IgG response and the induction of antigen-specific T follicular helper cells into draining lymph nodes after the two immunization schedules, a longer interval between priming and boosting elicited a higher number of germinal center-B cells and H56-specific antibody-secreting cells and modulated the effector function of reactivated CD4+ T cells. These data show that the scheduling of the booster immunization could affect the immune response elicited by vaccination modulating and improving the immunogenicity of the vaccine.
Keywords: B cell response; T cell response; alum; antibodies; immunization; prime–boost schedules.
Conflict of interest statement
The authors declare no conflict of interest.
Figures
Similar articles
-
Transcriptomics of the Vaccine Immune Response: Priming With Adjuvant Modulates Recall Innate Responses After Boosting.Front Immunol. 2018 Jun 5;9:1248. doi: 10.3389/fimmu.2018.01248. eCollection 2018. Front Immunol. 2018. PMID: 29922291 Free PMC article.
-
Heterologous Prime-Boost Combinations Highlight the Crucial Role of Adjuvant in Priming the Immune System.Front Immunol. 2018 Mar 12;9:380. doi: 10.3389/fimmu.2018.00380. eCollection 2018. Front Immunol. 2018. PMID: 29593710 Free PMC article.
-
Early T Follicular Helper Cell Responses and Germinal Center Reactions Are Associated with Viremia Control in Immunized Rhesus Macaques.J Virol. 2019 Feb 5;93(4):e01687-18. doi: 10.1128/JVI.01687-18. Print 2019 Feb 15. J Virol. 2019. PMID: 30463978 Free PMC article.
-
Impact of Extended Dosing Intervals and Ipsilateral Versus Contralateral Boosting on mRNA Vaccine Immunogenicity in Mice.Vaccines (Basel). 2025 Mar 1;13(3):263. doi: 10.3390/vaccines13030263. Vaccines (Basel). 2025. PMID: 40266125 Free PMC article.
-
CD4(+) T Cell Priming as Biomarker to Study Immune Response to Preventive Vaccines.Front Immunol. 2013 Dec 4;4:421. doi: 10.3389/fimmu.2013.00421. Front Immunol. 2013. PMID: 24363656 Free PMC article. Review.
Cited by
-
Safety and Immunogenicity of a Heterologous Booster of Protein Subunit Vaccine MVC-COV1901 after Two Doses of Adenoviral Vector Vaccine AZD1222.Vaccines (Basel). 2022 Oct 11;10(10):1701. doi: 10.3390/vaccines10101701. Vaccines (Basel). 2022. PMID: 36298566 Free PMC article.
-
Short- and Long-Interval Prime-Boost Vaccination with the Candidate Vaccines MVA-SARS-2-ST and MVA-SARS-2-S Induces Comparable Humoral and Cell-Mediated Immunity in Mice.Viruses. 2023 May 17;15(5):1180. doi: 10.3390/v15051180. Viruses. 2023. PMID: 37243266 Free PMC article.
-
Investigation of the Optimal Prime Boost Spacing Regimen for a Cancer Therapeutic Vaccine Targeting Human Papillomavirus.Cancers (Basel). 2022 Sep 5;14(17):4339. doi: 10.3390/cancers14174339. Cancers (Basel). 2022. PMID: 36077873 Free PMC article.
-
COVID-19 Vaccination within the Context of Reactogenicity and Immunogenicity of ChAdOx1 Vaccine Administered to Teachers in Poland.Int J Environ Res Public Health. 2022 Mar 6;19(5):3111. doi: 10.3390/ijerph19053111. Int J Environ Res Public Health. 2022. PMID: 35270806 Free PMC article.
-
Spike-Specific Memory B Cell Response in Hematopoietic Cell Transplantation Recipients following Multiple mRNA-1273 Vaccinations: A Longitudinal Observational Study.Vaccines (Basel). 2024 Mar 29;12(4):368. doi: 10.3390/vaccines12040368. Vaccines (Basel). 2024. PMID: 38675750 Free PMC article.
References
-
- Ciabattini A., Pettini E., Fiorino F., Lucchesi S., Pastore G., Brunetti J., Santoro F., Andersen P., Bracci L., Pozzi G., et al. Heterologous Prime-Boost Combinations Highlight the Crucial Role of Adjuvant in Priming the Immune System. Front. Immunol. 2018;9:380. doi: 10.3389/fimmu.2018.00380. - DOI - PMC - PubMed
Grants and funding
LinkOut - more resources
Full Text Sources
Other Literature Sources
Research Materials
