

Endogenously Produced SARS-CoV-2 Specific IgG Antibodies May Have a Limited Impact on Clearing Nasal Shedding of Virus during Primary Infection in Humans
- PMID: 33804667
- PMCID: PMC8003723
- DOI: 10.3390/v13030516
Endogenously Produced SARS-CoV-2 Specific IgG Antibodies May Have a Limited Impact on Clearing Nasal Shedding of Virus during Primary Infection in Humans
Abstract
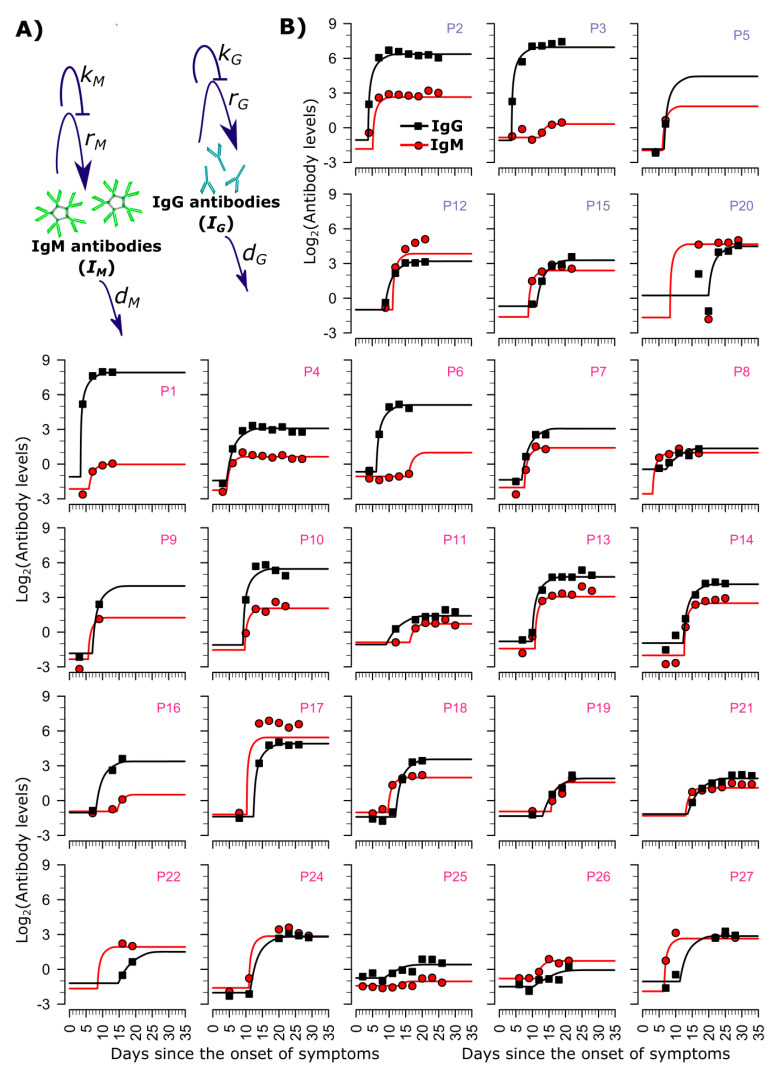
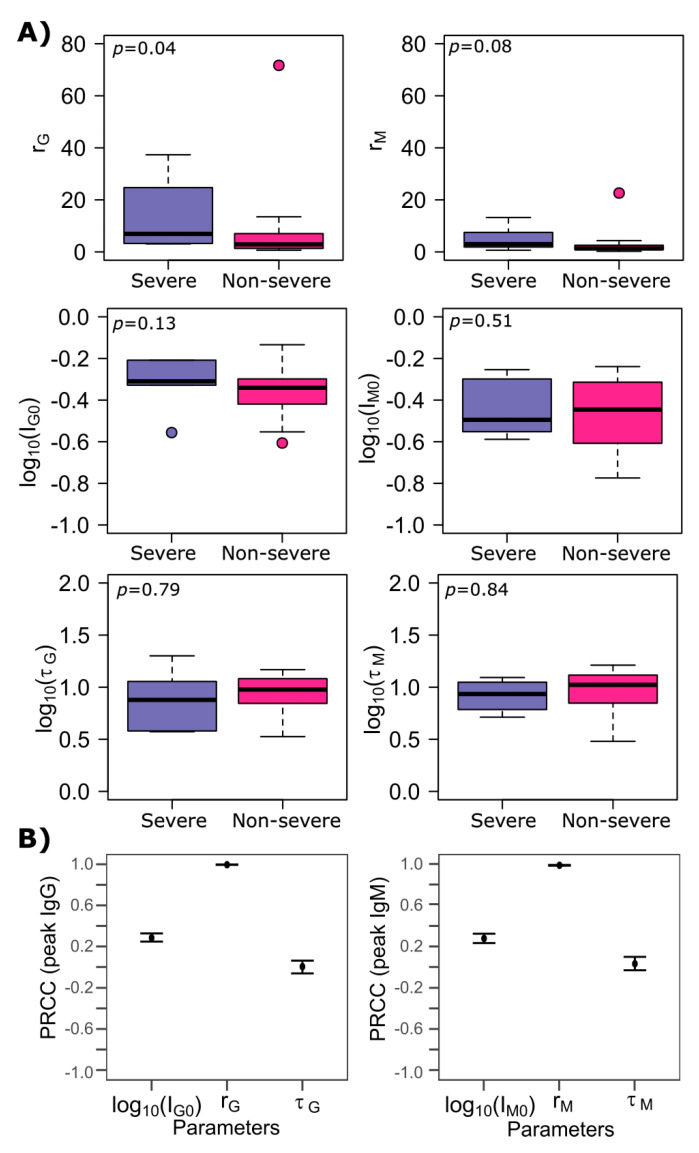
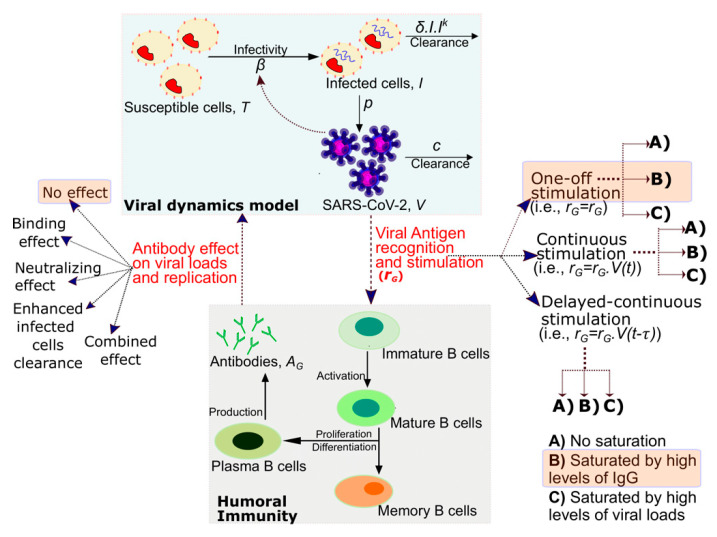
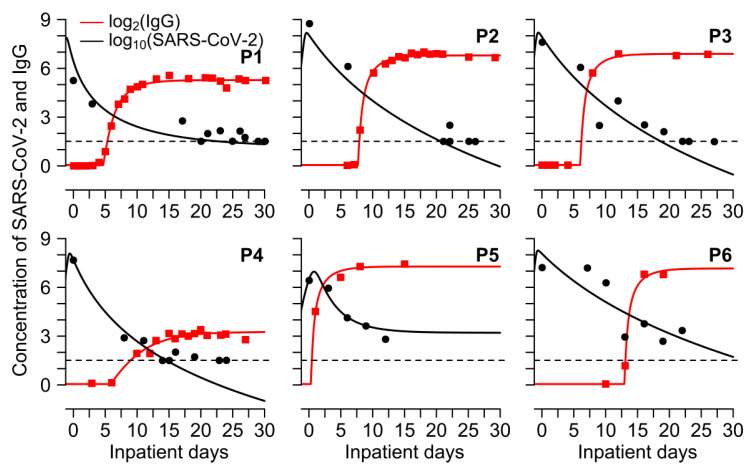
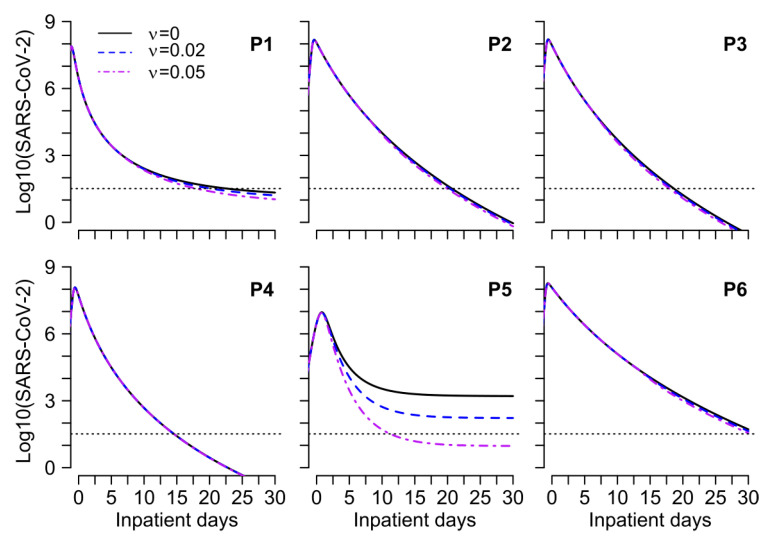
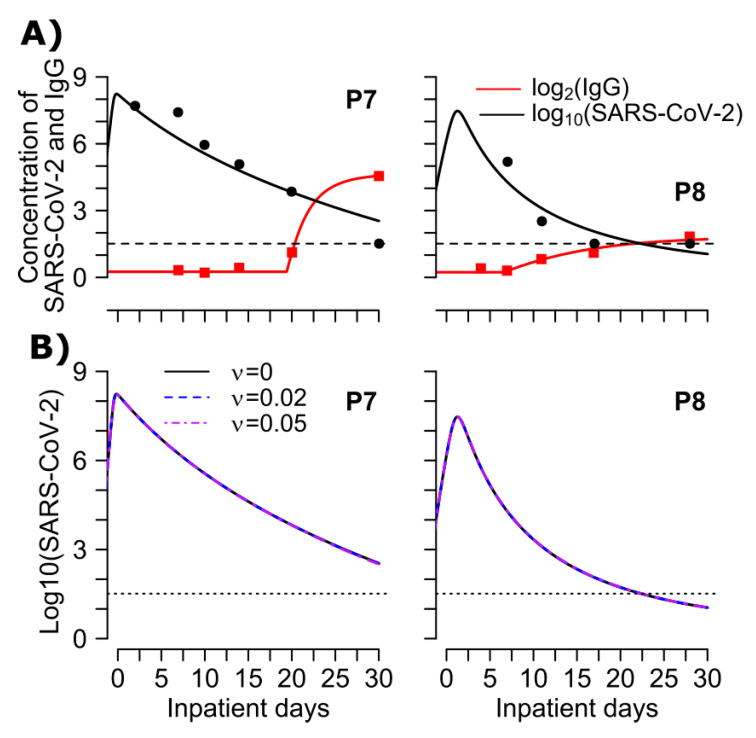
While SARS-CoV-2 specific neutralizing antibodies have been developed for therapeutic purposes, the specific viral triggers that drive the generation of SARS-CoV-2 specific IgG and IgM antibodies remain only partially characterized. Moreover, it is unknown whether endogenously derived antibodies drive viral clearance that might result in mitigation of clinical severity during natural infection. We developed a series of non-linear mathematical models to investigate whether SARS-CoV-2 viral and antibody kinetics are coupled or governed by separate processes. Patients with severe disease had a higher production rate of IgG but not IgM antibodies. Maximal levels of both isotypes were governed by their production rate rather than different saturation levels between people. Our results suggest that an exponential surge in IgG levels occurs approximately 5-10 days after symptom onset with no requirement for continual antigenic stimulation. SARS-CoV-2 specific IgG antibodies appear to have limited to no effect on viral dynamics but may enhance viral clearance late during primary infection resulting from the binding effect of antibody to virus, rather than neutralization. In conclusion, SARS-CoV-2 specific IgG antibodies may play only a limited role in clearing infection from the nasal passages despite providing long-term immunity against infection following vaccination or prior infection.
Keywords: IgG antibodies; IgM antibodies; SARS-CoV-2; mathematical model; severity.
Conflict of interest statement
The authors declare no conflict of interest.
Figures
Similar articles
-
Anti-SARS-CoV-2 Immunoglobulin Isotypes, and Neutralization Activity Against Viral Variants, According to BNT162b2-Vaccination and Infection History.Front Immunol. 2021 Dec 17;12:793191. doi: 10.3389/fimmu.2021.793191. eCollection 2021. Front Immunol. 2021. PMID: 34975897 Free PMC article.
-
Kinetics of SARS-CoV-2 Specific and Neutralizing Antibodies over Seven Months after Symptom Onset in COVID-19 Patients.Microbiol Spectr. 2021 Oct 31;9(2):e0059021. doi: 10.1128/Spectrum.00590-21. Epub 2021 Sep 22. Microbiol Spectr. 2021. PMID: 34550000 Free PMC article.
-
Long-Term Kinetics of SARS-CoV-2 Antibodies and Impact of Inactivated Vaccine on SARS-CoV-2 Antibodies Based on a COVID-19 Patients Cohort.Front Immunol. 2022 Jan 27;13:829665. doi: 10.3389/fimmu.2022.829665. eCollection 2022. Front Immunol. 2022. PMID: 35154152 Free PMC article.
-
Immune response following infection with SARS-CoV-2 and other coronaviruses: A rapid review.Rev Med Virol. 2021 Mar;31(2):e2162. doi: 10.1002/rmv.2162. Epub 2020 Sep 23. Rev Med Virol. 2021. PMID: 32964627 Free PMC article. Review.
-
Seroprevalence of SARS-CoV-2-specific antibodies in cancer outpatients in Madrid (Spain): A single center, prospective, cohort study and a review of available data.Cancer Treat Rev. 2020 Nov;90:102102. doi: 10.1016/j.ctrv.2020.102102. Epub 2020 Sep 1. Cancer Treat Rev. 2020. PMID: 32947121 Free PMC article. Review.
Cited by
-
Ensemble modeling of SARS-CoV-2 immune dynamics in immunologically naïve rhesus macaques predicts that potent, early innate immune responses drive viral elimination.Front Immunol. 2024 Nov 7;15:1426016. doi: 10.3389/fimmu.2024.1426016. eCollection 2024. Front Immunol. 2024. PMID: 39575237 Free PMC article.
-
Modeling Within-Host Dynamics of SARS-CoV-2 Infection: A Case Study in Ferrets.Viruses. 2021 Aug 18;13(8):1635. doi: 10.3390/v13081635. Viruses. 2021. PMID: 34452499 Free PMC article.
-
Heterogeneous SARS-CoV-2 kinetics due to variable timing and intensity of immune responses.medRxiv [Preprint]. 2024 Feb 7:2023.08.20.23294350. doi: 10.1101/2023.08.20.23294350. medRxiv. 2024. Update in: JCI Insight. 2024 Apr 4;9(9):e176286. doi: 10.1172/jci.insight.176286. PMID: 37662228 Free PMC article. Updated. Preprint.
-
Mechanistic Models of COVID-19: Insights into Disease Progression, Vaccines, and Therapeutics.Int J Antimicrob Agents. 2022 Jul;60(1):106606. doi: 10.1016/j.ijantimicag.2022.106606. Epub 2022 May 16. Int J Antimicrob Agents. 2022. PMID: 35588969 Free PMC article. Review.
-
Heterogeneous SARS-CoV-2 kinetics due to variable timing and intensity of immune responses.JCI Insight. 2024 Apr 4;9(9):e176286. doi: 10.1172/jci.insight.176286. JCI Insight. 2024. PMID: 38573774 Free PMC article.
References
-
- Self W.H., Tenforde M.W., Stubblefield W.B., Feldstein L.R., Steingrub J.S., Shapiro N.I., Ginde A.A., Prekker M.E., Brown S.M., Peltan I.D., et al. Decline in SARS-CoV-2 Antibodies after Mild Infection among Frontline Health Care Personnel in a Multistate Hospital Network-12 States, April–August 2020. MMWR Morb. Mortal Wkly. Rep. 2020;69:1762–1766. doi: 10.15585/mmwr.mm6947a2. - DOI - PMC - PubMed
-
- Perreault J., Tremblay T., Fournier M.-J., Drouin M., Beaudoin-Bussières G., Prévost J., Lewin A., Bégin P., Finzi A., Bazin R. Waning of SARS-CoV-2 RBD antibodies in longitudinal convalescent plasma samples within 4 months after symptom onset. Blood. 2020;136:2588–2591. doi: 10.1182/blood.2020008367. - DOI - PMC - PubMed
Publication types
MeSH terms
Substances
Grants and funding
LinkOut - more resources
Full Text Sources
Other Literature Sources
Medical
Miscellaneous
