. 2021 Mar 20;12(3):329.
doi: 10.3390/mi12030329.

Ultrasound-Based Scaffold-Free Core-Shell Multicellular Tumor Spheroid Formation

Affiliations

Ultrasound-Based Scaffold-Free Core-Shell Multicellular Tumor Spheroid Formation

Karl Olofsson et al. Micromachines (Basel). .

Abstract

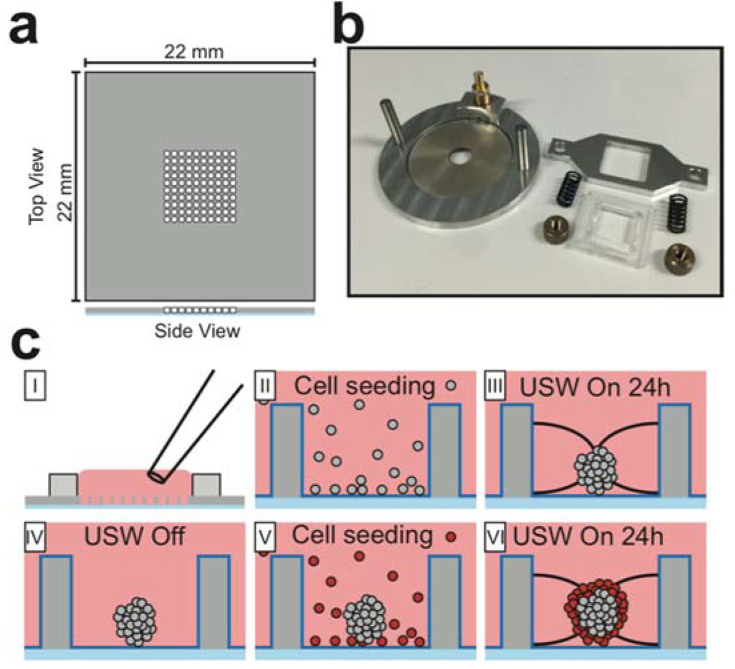
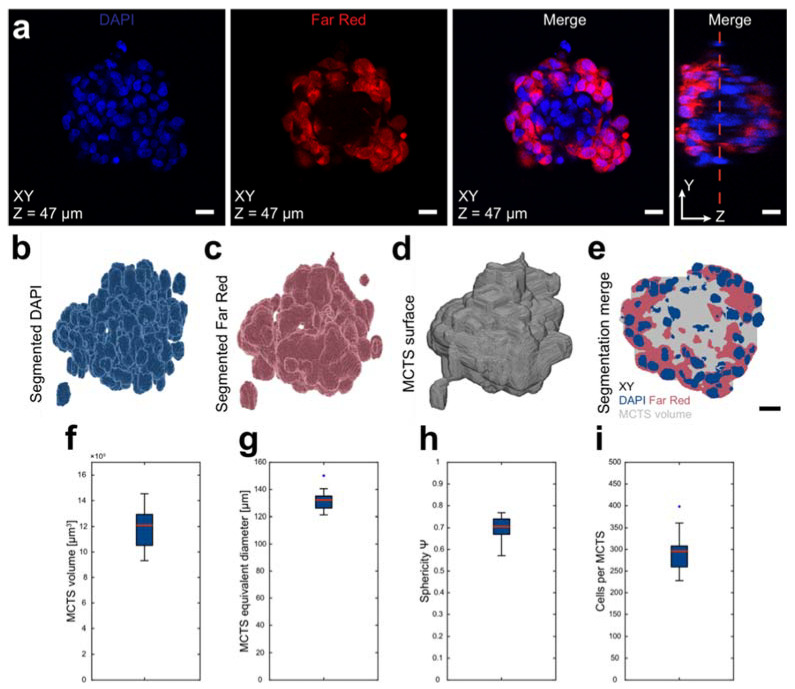
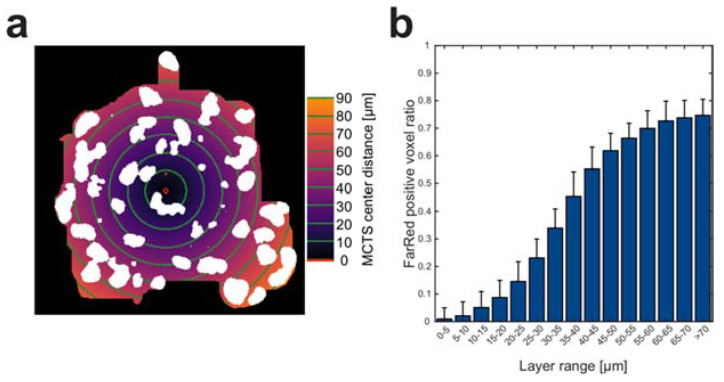
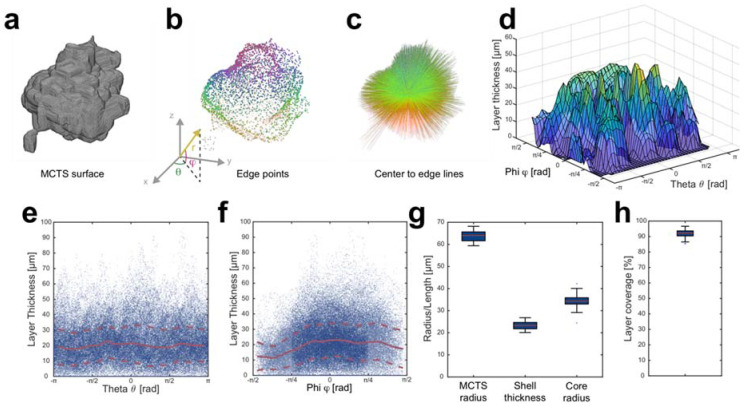
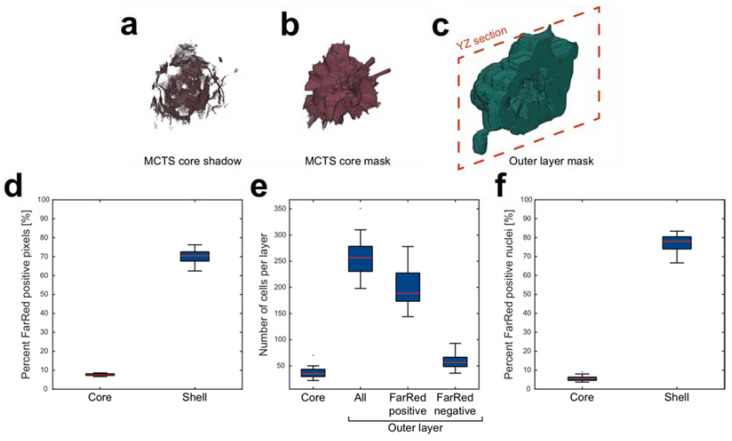
In cancer research and drug screening, multicellular tumor spheroids (MCTSs) are a popular model to bridge the gap between in vitro and in vivo. However, the current techniques to culture mixed co-culture MCTSs do not mimic the structural architecture and cellular spatial distribution in solid tumors. In this study we present an acoustic trapping-based core-shell MCTSs culture method using sequential seeding of the core and shell cells into microwells coated with a protein repellent coating. Scaffold-free core-shell ovarian cancer OVCAR-8 cell line MCTSs were cultured, stained, cleared and confocally imaged on-chip. Image analysis techniques were used to quantify the shell thickness (23.2 ± 1.8 µm) and shell coverage percentage (91.2 ± 2.8%). We also show that the shell thickness was evenly distributed over the MCTS cores with the exception of being slightly thinner close to the microwell bottom. This scaffold-free core-shell MCTSs formation technique and the analysis tools presented herein could be used as an internal migration assay within the MCTS or to form core-shell MCTS co-cultures to study therapy response or the interaction between tumor and stromal cells.

Keywords: 3D culture; 3D image analysis; acoustophoresis; core-shell spheroids; multicellular tumor spheroids; multiwell microplate.


Conflict of interest statement

The authors declare no conflict of interest. The funders had no role in the design of the study; in the collection, analyses, or interpretation of data; in the writing of the manuscript, or in the decision to publish the results.

Figures

Figure 1
Figure 1
Ultrasound based layered multicellular tumor spheroids (MCTS) formation. The multi-well microplate (a) consists of a 22 × 22 × 0.3 mm3 silicon plate with 100 microwells (350 × 350 µm2) etched straight through the silicon layer and a 170 µm thick glass plate bonded to the bottom. The multiwell microplate was fixed on a circular transducer (b) with immersion oil as coupling medium to introduce ultrasonic standing waves (USWs) into the microwells. To form core-shell MCTSs (c), cells were seeded with a regular pipette into the shared medium reservoir above the microwells (I) and allowed to sediment to the well bottoms (II). The microplate was then transferred to the transducer which was actuated with a frequency corresponding to the λ/2-criterion across the microwell width. The radiation forces trapped all cells in an aggregate in the microwell center for 24 h (III). The microplate was dissembled from the transducer (IV) and cells comprising the shell were seeded around the preformed MCTS core (V) before the radiation forces were reintroduced for 24 h to create the core-shell MCTSs (VI).
Figure 2
Figure 2
Raw data, segmentation strategy and core-shell MCTS characteristics. After 48 h (24 + 24 h) of USW formation, the core-shell MCTS were fixed, stained with DAPI (Invitrogen) and cleared. All cells were stained with DAPI while cells in the shell were identified by Far Red staining (a). The red dotted line in the YZ plane indicates the XY optical section. Using a local adaptive thresholding algorithm, the DAPI (b) and Far Red (c) were segmented and used to approximate the MCTS surface and full volume (d). An XY-section in the merged segmented volume is shown as reference (e). The MCTS surfaces from 20 MCTSs imaged by confocal microscopy were used to measure layered MCTS volume (f), which has an equivalent diameter of a sphere with the same volume as the MCTS (g) and sphericity Ψ (h). Using the median nucleus volume after a watershed algorithm in the segmented DAPI, the number of cells was estimated as total DAPI volume divided by the volume of a single nucleus (i). Boxplots show the 25th and 75th percentiles with a red line marking the median value. The whiskers show the furthest observation 1.5 times the interquartile length away from the box edge while outliers are marked with a blue dot. Scalebars are 20 µm.
Figure 3
Figure 3
Cellular arrangement in core-shell spheroids. Each MCTS (n = 20) was divided into 5 µm thick concentric layers (every 10 µm marked by green lines) based on distance (colormap indicates distance away from center) from the MCTS center (red dot) (a). The ratio between Far Red positive voxels against total number of voxels was calculated in all layers (b). Scale bar is 20 µm.
Figure 4
Figure 4
Center to edge line-analysis assessing direction dependent MCTS core and shell thickness distribution. Using the core-shell MCTS surface (a), 5000 equidistantly spaced points were defined on each MCTS by using spherical coordinates (radial distance r, polar angle φ [−π/2 ≤ φ ≤ π/2] and azimuth angle θ [−π ≤ θ ≤ π]) with the origin placed in the MCTS core center point (b). The voxels along the lines between the MCTS core center and each edge point (c) were evaluated in the segmented Far Red volume to acquire the shell thickness (number of Far Red positive voxels times length per voxel) as a function of the polar and azimuth angle in each MCTS (d). The color of the points and lines corresponds to the position along the z-axis (b,c). Line data points (blue dots) pooled from all (n = 20) core-shell MCTSs shows the shell thickness distribution as a function of azimuth (e) and polar angle (f). The mean (solid red line) and standard deviation (dashed red line) were calculated in π/10 (e) and π/20 (f) wide angle segments for the azimuth and polar angle respectively. The line data were used to measure the average MCTS radius, shell thickness and inner core radius in each MCTS (g). All lines not including any Far Red positive voxels were used to measure the shell core coverage percentage (h). Boxplots show the 25th and 75th percentiles with a red line marking the median value. The whiskers show the furthest observation 1.5 times the interquartile length away from the box edge while outliers are marked with a blue dot.
Figure 5
Figure 5
Edge-line analysis enables core and shell segmentation for content analysis. The outer edge points of the MCTS core (MCTS core shadow) was detected by identifying the first Far Red positive voxel in each edge-center line (a) and used to create a core mask (b). The full MCTS volume subtracted by the core mask was used to define the shell mask (centrally placed void illustrates the border between shell and core in the YZ plane marked by a dashed red line) (c). The ratio between far red positive voxels and the total amount of voxels was calculated (d) and the numbers of cells in the core, shell, far red positive and far red negative parts of the shell were estimated by dividing the total DAPI volume by the median nucleus volume in each compartment (e). The number of cells in each compartment was used to calculate the number of cells that was found in the Far Red positive volume (f). Boxplots show the 25th and 75th percentiles with a red line marking the median value. The whiskers show the furthest observation 1.5 times the interquartile length away from the box edge while outliers are marked with a blue dot.

References

    1. Hanahan D., Weinberg R.A. Hallmarks of Cancer: The Next Generation. Cell. 2011;144:646–674. doi: 10.1016/j.cell.2011.02.013. - DOI - PubMed
    1. Lu P., Weaver V.M., Werb Z. The extracellular matrix: A dynamic niche in cancer progression. J. Cell Biol. 2012;196:395–406. doi: 10.1083/jcb.201102147. - DOI - PMC - PubMed
    1. Fennema E., Rivron N., Rouwkema J., van Blitterswijk C., de Boer J. Spheroid culture as a tool for creating 3D complex tissues. Trends Biotechnol. 2013;31:108–115. doi: 10.1016/j.tibtech.2012.12.003. - DOI - PubMed
    1. Pampaloni F., Reynaud E.G., Stelzer E.H.K. The third dimension bridges the gap between cell culture and live tissue. Nat. Rev. Mol. Cell Biol. 2007;8:839–845. doi: 10.1038/nrm2236. - DOI - PubMed
    1. Mehta G., Hsiao A.Y., Ingram M., Luker G.D., Takayama S. Opportunities and challenges for use of tumor spheroids as models to test drug delivery and efficacy. J. Control. Release. 2012;164:192–204. doi: 10.1016/j.jconrel.2012.04.045. - DOI - PMC - PubMed