. 2021 Mar 20;26(6):1748.
doi: 10.3390/molecules26061748.

A Proteomics Study on the Mechanism of Nutmeg-Induced Hepatotoxicity

Affiliations

A Proteomics Study on the Mechanism of Nutmeg-Induced Hepatotoxicity

Wei Xia et al. Molecules. .

Abstract

Nutmeg is a traditional spice and medicinal plant with a variety of pharmacological activities. However, nutmeg abuse due to its hallucinogenic characteristics and poisoning cases are frequently reported. Our previous metabolomics study proved the hepatotoxicity of nutmeg and demonstrated that high-dose nutmeg can affect the synthesis and secretion of bile acids and cause oxidative stress. In order to further investigate the hepatotoxicity of nutmeg, normal saline, 1 g/kg, 4 g/kg nutmeg were administrated to male Kunming mice by intragastrical gavage for 7 days. Histopathological investigation of liver tissue, proteomics and biochemical analysis were employed to explore the mechanism of liver damage caused by nutmeg. The results showed that a high-dose (4 g/kg) of nutmeg can cause significant increased level of CYP450s and depletion of antioxidants, resulting in obvious oxidative stress damage and lipid metabolism disorders; but this change was not observed in low-dose group (1 g/kg). In addition, the increased level of malondialdehyde and decreased level of glutathione peroxidase were found after nutmeg exposure. Therefore, the present study reasonably speculates that nutmeg exposure may lead to liver injury through oxidative stress and the degree of this damage is related to the exposure dose.

Keywords: CYP450s; hepatotoxicity; lipid peroxidation; nutmeg; oxidative stress; proteomics.


Conflict of interest statement

The authors declare no conflict of interest.

Figures

Figure 1
Figure 1
Hematoxylin and Eosin (H&E) staining of liver tissue after nutmeg exposure (200×). (A,B), control group; (C,D), low-dose group; (E,F), high-dose group.
Figure 2
Figure 2
The volcano plots of differentially expressed proteins (DEPs) between different groups. (A) low-dose group vs. control group. (B) high-dose group vs. control group; (C) high-dose vs. low-dose group. Significant difference for the p value on vertical ordinate (Base 10 logarithmic transformation). Red dots represent up-regulated; green dots represent down-regulated; black dots represent no significant difference.
Figure 3
Figure 3
The heatmaps of differentially expressed proteins (DEPs) between different groups. (A) low-dose group vs. control group. (B) high-dose group vs. control group; (C) high-dose vs. low-dose group. Red represents up-regulation and blue represents down-regulation.
Figure 4
Figure 4
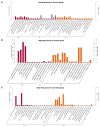
Functional enrichment of Gene Ontology (GO) annotation (Top 20) for differentially expressed proteins (DEPs). (A) low-dose group vs. control group. (B) high-dose group vs. control group; (C) high-dose vs. low-dose group. BP: biological Process, CC: Cellular Component, MF: Molecular Function. The left ordinate represents the number of detected differential proteins associated with the GO as a percentage of the number of differential proteins annotated by GO and the right ordinate represents the number of detected differential proteins associated with the GO.
Figure 5
Figure 5
The KEGG pathway enrichment analysis of different groups. (A) low-dose group vs. control group. (B) high-dose group vs. control group; (C) high-dose vs. low-dose group. The abscissa represents the ratio of the number of differential proteins associated with the pathway to the number of background (all) proteins associated with the pathway. The redder the bubble represents the smaller the p value, the bluer the bubble represents the larger the p value and the larger the bubble represents the more differential proteins detected.
Figure 6
Figure 6
PPI networks of differentially expressed proteins (DEPs) between different groups. (A) low-dose group vs. control group. (B) high-dose group vs. control group; (C) high-dose vs. low-dose group. Red nodes represent up-regulated proteins and blue nodes represent down-regulated proteins.
Figure 7
Figure 7
Serum monoamine oxidase (MAO) and live tissue glutathione peroxidase (GSH-Px), malondialdehyde (MDA) and glutathione s-transferase (GSTs) levels of mice after different doses exposure of nutmeg. (A) serum MAO level; (B) liver tissue GSH-Px level; (C) liver tissue MDA level; (D) liver tissue GSTs level. * p < 0.05. Total degrees of freedom, 17; degrees of freedom within groups, 15; degrees of freedom between groups, 2.

Similar articles

Cited by

References

    1. Payne R.B. Nutmeg Intoxication. N. Engl. J. Med. 1963;269:36–38. doi: 10.1056/NEJM196307042690108. - DOI - PubMed
    1. Carstairs S.D., Cantrell F.L. The spice of life: An analysis of nutmeg exposures in California. Clin. Toxicol. 2011;49:177–180. doi: 10.3109/15563650.2011.561210. - DOI - PubMed
    1. Beckerman B., Persaud H. Nutmeg overdose: Spice not so nice. Complement. Ther. Med. 2019;46:44–46. doi: 10.1016/j.ctim.2019.07.011. - DOI - PubMed
    1. Hayfaa A.A.-S., Sahar A.M.A.-S., Awatif M.A.-S. Evaluation of analgesic activity and toxicity of alkaloids in Myristica fragrans seeds in mice. J. Pain Res. 2013;6:611–615. doi: 10.2147/JPR.S45591. - DOI - PMC - PubMed
    1. McKenna A., Nordt S.P., Ryan J. Acute nutmeg poisoning. Eur. J. Emerg. Med. 2004;11:240–241. doi: 10.1097/01.mej.0000127649.69328.a5. - DOI - PubMed

Substances

LinkOut - more resources