. 2021 Mar 20;10(3):693.
doi: 10.3390/cells10030693.

Voluntary Wheel Running Did Not Alter Gene Expression in 5xfad Mice, but in Wild-Type Animals Exclusively after One-Day of Physical Activity

Affiliations

Voluntary Wheel Running Did Not Alter Gene Expression in 5xfad Mice, but in Wild-Type Animals Exclusively after One-Day of Physical Activity

Anna Wierczeiko et al. Cells. .

Abstract

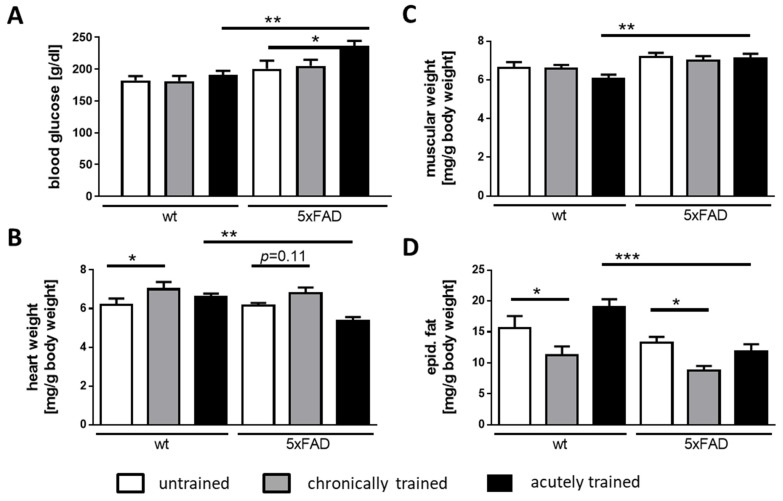
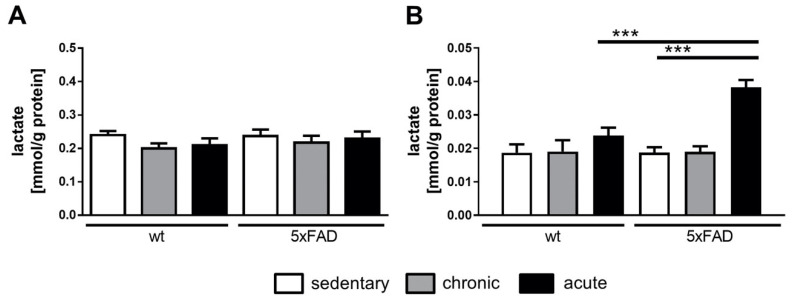
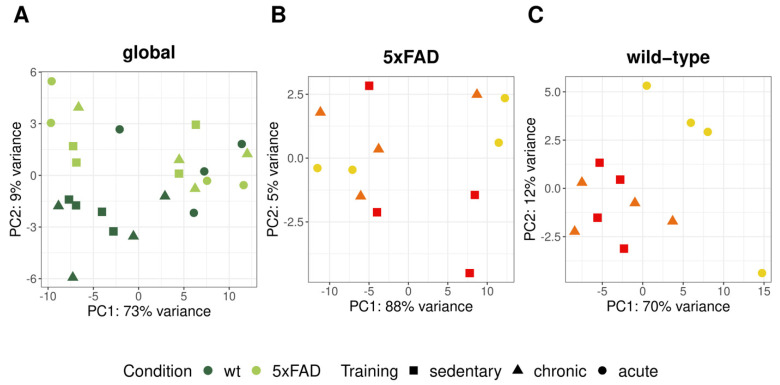
Physical activity is considered a promising preventive intervention to reduce the risk of developing Alzheimer's disease (AD). However, the positive effect of therapeutic administration of physical activity has not been proven conclusively yet, likely due to confounding factors such as varying activity regimens and life or disease stages. To examine the impact of different routines of physical activity in the early disease stages, we subjected young 5xFAD and wild-type mice to 1-day (acute) and 30-day (chronic) voluntary wheel running and compared them with age-matched sedentary controls. We observed a significant increase in brain lactate levels in acutely trained 5xFAD mice relative to all other experimental groups. Subsequent brain RNA-seq analysis did not reveal major differences in transcriptomic regulation between training durations in 5xFAD mice. In contrast, acute training yielded substantial gene expression changes in wild-type animals relative to their chronically trained and sedentary counterparts. The comparison of 5xFAD and wild-type mice showed the highest transcriptional differences in the chronic and sedentary groups, whereas acute training was associated with much fewer differentially expressed genes. In conclusion, our results suggest that different training durations did not affect the global transcriptome of 3-month-old 5xFAD mice, whereas acute running seemed to induce a similar transcriptional stress state in wild-type animals as already known for 5xFAD mice.

Keywords: 5xFAD; Alzheimer’s disease; acute; chronic; physical activity; wheel running.


Conflict of interest statement

The authors declare no conflict of interest. The funders had no role in the design of the study; in the collection, analyses, or interpretation of data; in the writing of the manuscript, or in the decision to publish the results.

Figures

Figure 1
Figure 1
Training groups and the comparison of first night and chronic saucer wheel usage. (A) Schematic of the three groups used for the investigation. All animals were single-caged and kept in type II macrolon cages for 30 days. The untrained group had no access to a saucer wheel, the chronically trained group kept the wheel over the whole time period, and the acutely trained mice had access only for the last night. Wheel turning counts per hour were measured for new access to the saucer wheel (B) and the chronic usage (C). Data are presented as mean of the performance over the 30 days of the chronically trained mice (n = 10 for wild-type, n = 8 for 5xFAD mice). Error bars are not visualized for clarity of the graph. Statistical analysis: multiple unpaired t-tests (* p < 0.05; *** p < 0.001).
Figure 2
Figure 2
Bodyweight development and food intake of 5xFAD and wild-type mice depending on physical training. (A) Body weight was measured at the same time of the day two times weekly. Here, the start weight and the weight at the end of the experiment are indicated. (B) Food consumption was measured weekly and is calculated per day. Data are presented as mean + standard error of the mean (SEM) (n = 6 for untrained and acutely trained, n = 7 for chronically trained mice). Statistical analysis: ordinary one-way ANOVA with the Fisher’s least significant difference (LSD) test (* p < 0.05; *** p < 0.001).
Figure 3
Figure 3
Physical parameters in 5xFAD and wild-type mice after different activity regimens. Upon sacrifice, truncal blood glucose was measured (A) and Gastrocnemius of both hind legs (B), heart (C), and abdominal fat (D) were dissected and weighed. Data are presented as mean + SEM (n = 6 for untrained and acutely trained, n = 7 for chronically trained mice). Statistical analysis: ordinary one-way ANOVA with the Fisher LSD test (* p < 0.05; ** p < 0.01; *** p < 0.001).
Figure 4
Figure 4
Lactate levels in serum (A) and brain tissue (B) homogenates of 5xFAD and wild-type mice. Serum and brain homogenate lactate were assessed by an enzymatic assay. Values were normalized to protein content and are presented as mean + SEM (n = 6 for untrained and acutely trained, n = 7 for chronically trained mice). Statistical analysis: ordinary one-way ANOVA with the Fisher LSD test (*** p < 0.001).
Figure 5
Figure 5
Principal component analysis of normalized RNA counts from 5xFAD and wild-type mice after different training regimens. Using principal component analysis, the highest variances within the gene counts corresponding to principal component 1 (PC1) and principal component 2 (PC2) were calculated and plotted for (A) all (n = 24), (B) 5xFAD (n = 12), and (C) wild-type (n = 12) mice. In (A), dark green dots represent wild-type samples, while light green dots correspond to 5xFAD mice. The shapes of the symbols and the colors in (B,C) show the different training groups (red + circle = acute, orange + triangle = chronic, and yellow + squares = sedentary). The corresponding legend is located on the bottom.
Figure 6
Figure 6
Differential expression analysis results of different physical activity levels among wild-type mice. The volcano plots in (AC) visualize the negative log10 of the adjusted p-value and the corresponding log2-fold change of the differential expression analyses between (A) chronic training and no training (B) acute training and no training (C) acute training and chronic training of wild-type mice. Each group consisted of four samples. Positive and negative log2-fold change values correspond to up- and downregulation in chronic (A) and acute training (B) compared to no training and acute training (C) compared to chronic training. Differentially expressed genes (DEGs) with an adjusted p-value < 0.05 are colored in red or blue corresponding to up- or downregulation, respectively. The five most significant genes are labeled by their gene symbols. All non-significant genes are colored gray. (D) shows the intersection of the DEGs found in each comparison. Empty fields represent a zero overlap. In (E), the number of genes for significantly enriched Gene Ontology (GO) terms of the acute-specific up- and downregulated genes from the differential expression analysis (DEA) of acute vs. sedentary and acute vs. chronic groups is visualized using bar plots. The color represents the significance of the adjusted p-value. (F) shows the cell type enrichment results for the acute-training-specific genes. The right and left bars correspond to upregulated and downregulated genes represented by the red and blue arrows’ direction. Green bars correspond to significantly enriched cell-types, while gray represents no significance.
Figure 7
Figure 7
Differential expression analysis results of 5xFAD compared to wild-type mice at different levels of physical activity. The volcano plots in A–C visualize the negative log10 of the adjusted p-value and the corresponding log2-fold change of the differential expression analyses between (A) sedentary 5xFAD vs. wild-type mice, (B) chronically trained 5xFAD vs. wild-type mice, and (C) acutely trained 5xFAD vs. wild-type mice. Each group consisted of four samples. Positive and negative log2-fold change values correspond to up- and downregulated genes in 5xFAD mice at the respective level of physical activity. Differentially expressed genes with an adjusted p-value < 0.05 are colored in red or blue, corresponding to up- or downregulation. The five most significant genes are labeled by their gene symbols. All non-significant genes are colored gray. (D) shows the intersection of the DEGs found in each comparison. Empty fields represent a zero overlap. (E) shows the cell type enrichment results for the sedentary-specific (left) and chronic-specific DEGs (right) while the right and left bars correspond to upregulated and downregulated genes represented by the direction of the red and blue arrows. Green bars visualize significantly enriched cell-types, while gray represents no significance.

Similar articles

Cited by

References

    1. Roth G.A., Abate D., Abate K.H., Abay S.M., Abbafati C., Abbasi N., Abbastabar H., Abd-Allah F., Abdela J., Abdelalim A., et al. Global, Regional, and National Age-Sex-Specific Mortality for 282 Causes of Death in 195 Countries and Territories, 1980–2017: A Systematic Analysis for the Global Burden of Disease Study 2017. Lancet. 2018;392:1736–1788. doi: 10.1016/S0140-6736(18)32203-7. - DOI - PMC - PubMed
    1. Conde-Sala J.L., Turró-Garriga O., Piñán-Hernández S., Portellano-Ortiz C., Viñas-Diez V., Gascón-Bayarri J., Reñé-Ramírez R. Effects of Anosognosia and Neuropsychiatric Symptoms on the Quality of Life of Patients with Alzheimer’s Disease: A 24-Month Follow-up Study. Int. J. Geriatr. Psychiatry. 2016;31:109–119. doi: 10.1002/gps.4298. - DOI - PubMed
    1. McKhann G., Drachman D., Folstein M., Katzman R., Price D., Stadlan E.M. Clinical Diagnosis of Alzheimer’s Disease: Report of the NINCDS-ADRDA Work Group under the Auspices of Department of Health and Human Services Task Force on Alzheimer’s Disease. Neurology. 1984;34:939–944. doi: 10.1212/WNL.34.7.939. - DOI - PubMed
    1. Luque-Contreras D., Carvajal K., Toral-Rios D., Franco-Bocanegra D., Campos-Peña V. Oxidative Stress and Metabolic Syndrome: Cause or Consequence of Alzheimer’s Disease? Oxidative Med. Cell. Longev. 2014;2014:1–11. doi: 10.1155/2014/497802. - DOI - PMC - PubMed
    1. Calsolaro V., Edison P. Neuroinflammation in Alzheimer’s Disease: Current Evidence and Future Directions. Alzheimer’s Dement. 2016;12:719–732. doi: 10.1016/j.jalz.2016.02.010. - DOI - PubMed

Publication types