

Possibility for Transcriptional Targeting of Cancer-Associated Fibroblasts-Limitations and Opportunities
- PMID: 33804861
- PMCID: PMC8038081
- DOI: 10.3390/ijms22073298
Possibility for Transcriptional Targeting of Cancer-Associated Fibroblasts-Limitations and Opportunities
Abstract
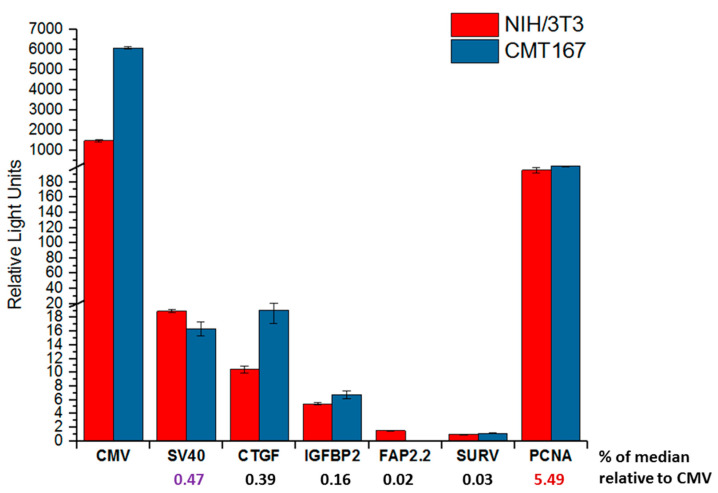
Cancer-associated fibroblasts (CAF) are attractive therapeutic targets in the tumor microenvironment. The possibility of using CAFs as a source of therapeutic molecules is a challenging approach in gene therapy. This requires transcriptional targeting of transgene expression by cis-regulatory elements (CRE). Little is known about which CREs can provide selective transgene expression in CAFs. We hypothesized that the promoters of FAP, CXCL12, IGFBP2, CTGF, JAG1, SNAI1, and SPARC genes, the expression of whose is increased in CAFs, could be used for transcriptional targeting. Analysis of the transcription of the corresponding genes revealed that unique transcription in model CAFs was characteristic for the CXCL12 and FAP genes. However, none of the promoters in luciferase reporter constructs show selective activity in these fibroblasts. The CTGF, IGFBP2, JAG1, and SPARC promoters can provide higher transgene expression in fibroblasts than in cancer cells, but the nonspecific viral promoters CMV, SV40, and the recently studied universal PCNA promoter have the same features. The patterns of changes in activity of various promoters relative to each other observed for human cell lines were similar to the patterns of activity for the same promoters both in vivo and in vitro in mouse models. Our results reveal restrictions and features for CAF transcriptional targeting.
Keywords: fibroblasts; gene therapy; promoter; transcriptional targeting; tumor microenvironment.
Conflict of interest statement
The authors declare no conflicts of interest. The funders had no role in the design of the study; in the collection, analyses, or interpretation of data; in the writing of the manuscript, or in the decision to publish the results.
Figures


Similar articles
-
Activation of the A2B adenosine receptor in B16 melanomas induces CXCL12 expression in FAP-positive tumor stromal cells, enhancing tumor progression.Oncotarget. 2016 Sep 27;7(39):64274-64288. doi: 10.18632/oncotarget.11729. Oncotarget. 2016. PMID: 27590504 Free PMC article.
-
Mechanistic Characterization of Cancer-associated Fibroblast Depletion via an Antibody-Drug Conjugate Targeting Fibroblast Activation Protein.Cancer Res Commun. 2024 Jun 12;4(6):1481-1494. doi: 10.1158/2767-9764.CRC-24-0248. Cancer Res Commun. 2024. PMID: 38747612 Free PMC article.
-
Reshaping Prostate Tumor Microenvironment To Suppress Metastasis via Cancer-Associated Fibroblast Inactivation with Peptide-Assembly-Based Nanosystem.ACS Nano. 2019 Nov 26;13(11):12357-12371. doi: 10.1021/acsnano.9b04857. Epub 2019 Sep 30. ACS Nano. 2019. PMID: 31545587
-
[FIBROBLAST ACTIVATION PROTEIN (FAP) AS A POSSIBLE TARGET OF THE ANTITUMOR STRATEGY.].Mol Gen Mikrobiol Virusol. 2016;34(3):90-97. Mol Gen Mikrobiol Virusol. 2016. PMID: 30383930 Review. Russian.
-
Fibroblast activation protein α in tumor microenvironment: recent progression and implications (review).Mol Med Rep. 2015 May;11(5):3203-11. doi: 10.3892/mmr.2015.3197. Epub 2015 Jan 14. Mol Med Rep. 2015. PMID: 25593080 Free PMC article. Review.
Cited by
-
Cell-specific expression of the FAP gene is regulated by enhancer elements.Front Mol Biosci. 2023 Feb 7;10:1111511. doi: 10.3389/fmolb.2023.1111511. eCollection 2023. Front Mol Biosci. 2023. PMID: 36825204 Free PMC article.
-
Efficiency of Promoters of Human Genes FAP and CTGF at Organism Level in a Danio rerio Model.Int J Mol Sci. 2023 Apr 13;24(8):7192. doi: 10.3390/ijms24087192. Int J Mol Sci. 2023. PMID: 37108352 Free PMC article.
-
Define cancer-associated fibroblasts (CAFs) in the tumor microenvironment: new opportunities in cancer immunotherapy and advances in clinical trials.Mol Cancer. 2023 Oct 2;22(1):159. doi: 10.1186/s12943-023-01860-5. Mol Cancer. 2023. PMID: 37784082 Free PMC article. Review.
-
Spheroids of FAP-Positive Cell Lines as a Model for Screening Drugs That Affect FAP Expression.Biomedicines. 2023 Jul 18;11(7):2017. doi: 10.3390/biomedicines11072017. Biomedicines. 2023. PMID: 37509656 Free PMC article.
References
-
- Lee J.C., Shin D.W., Park H., Kim J., Youn Y., Kim J.H., Hwang J.H. Tolerability and safety of EUS-injected adenovirus-mediated double-suicide gene therapy with chemotherapy in locally advanced pancreatic cancer: A phase 1 trial. Gastrointest. Endosc. 2020;92:1044–1052.e1. doi: 10.1016/j.gie.2020.02.012. - DOI - PubMed
MeSH terms
Substances
Grants and funding
LinkOut - more resources
Full Text Sources
Other Literature Sources
Research Materials
Miscellaneous
