. 2021 Mar 24;13(7):1490.
doi: 10.3390/cancers13071490.

3D Model Characterization by 2D and 3D Imaging in t(14;18)-Positive B-NHL: Perspectives for In Vitro Drug Screens in Follicular Lymphoma

Affiliations

3D Model Characterization by 2D and 3D Imaging in t(14;18)-Positive B-NHL: Perspectives for In Vitro Drug Screens in Follicular Lymphoma

Fabien Gava et al. Cancers (Basel). .

Abstract

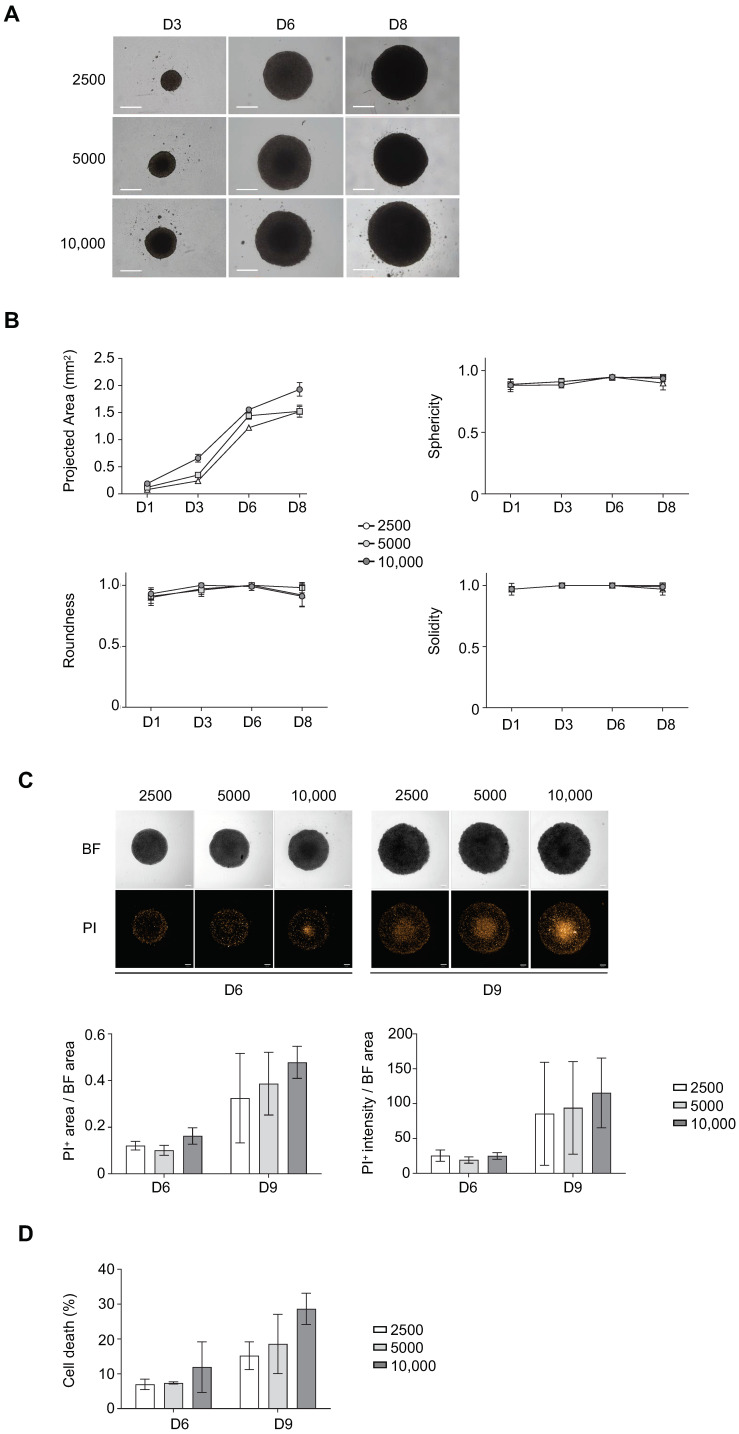
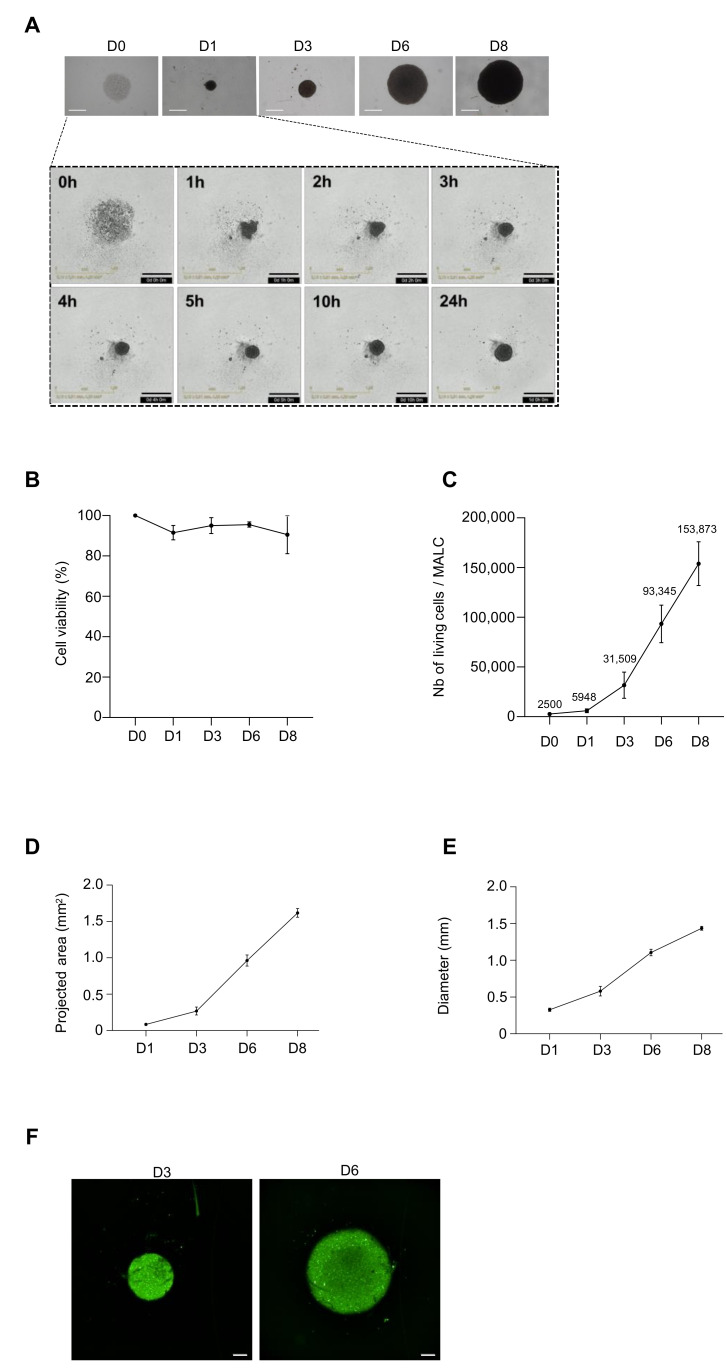
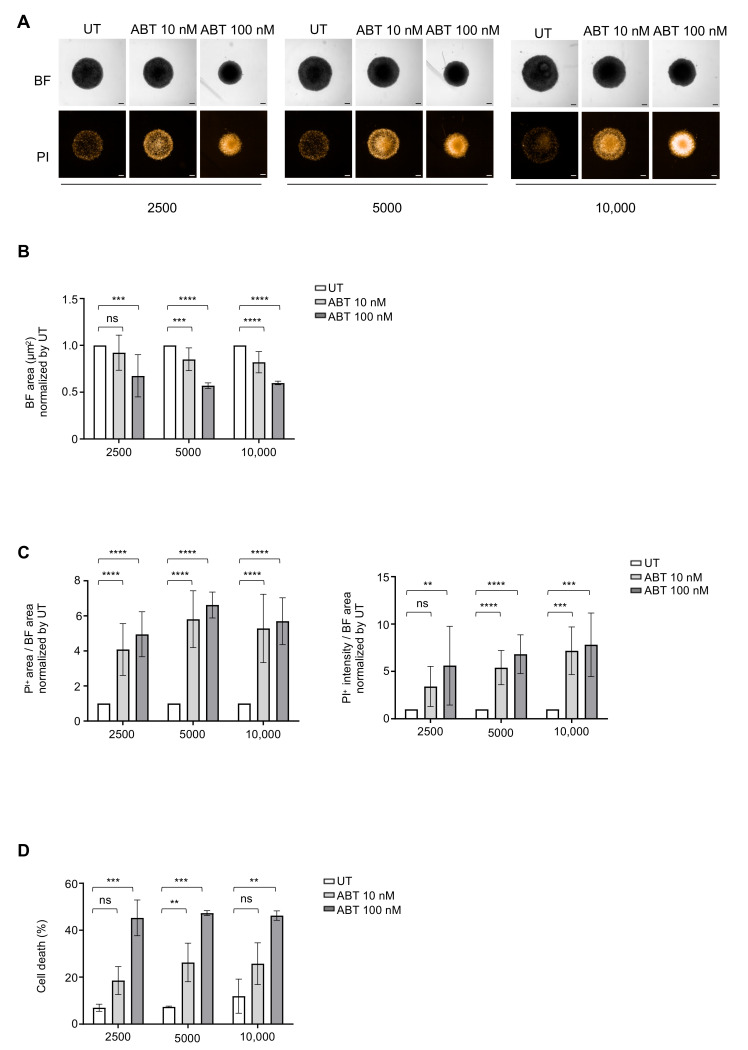
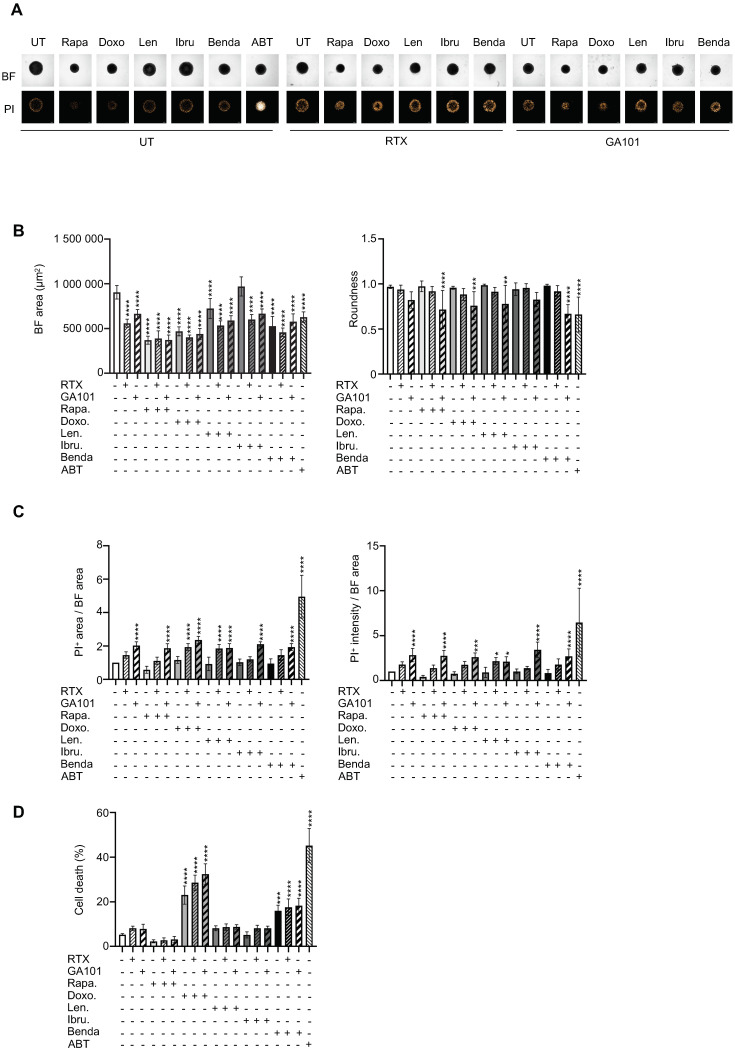
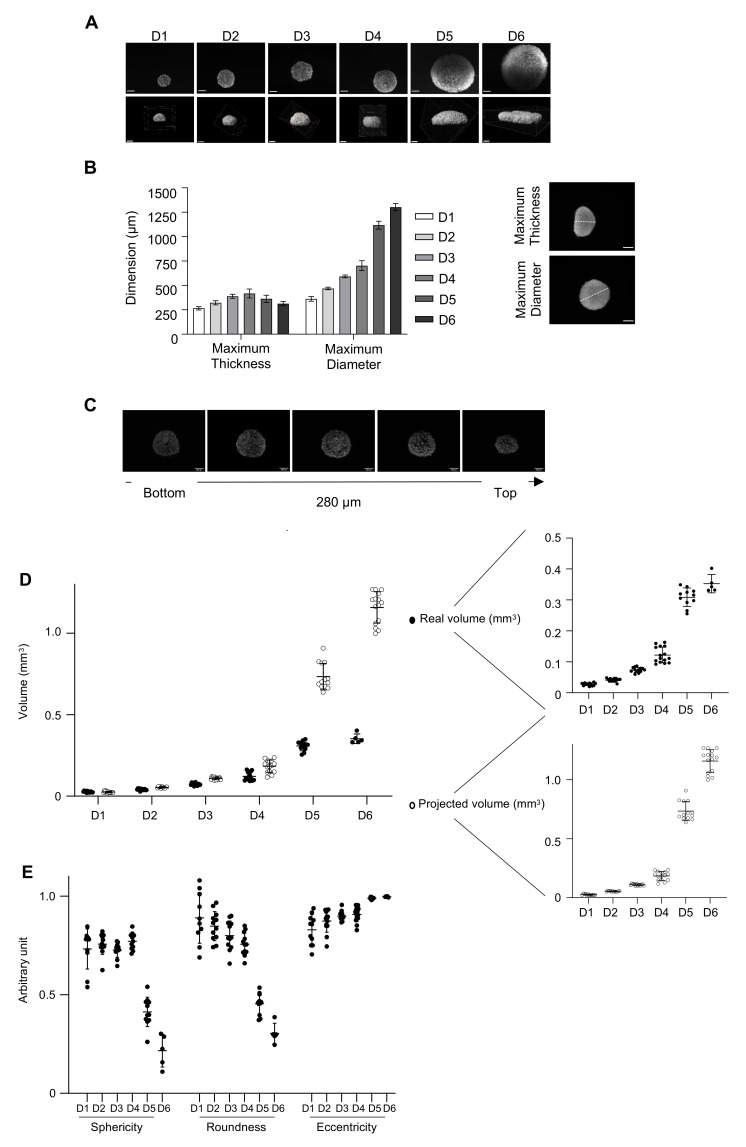
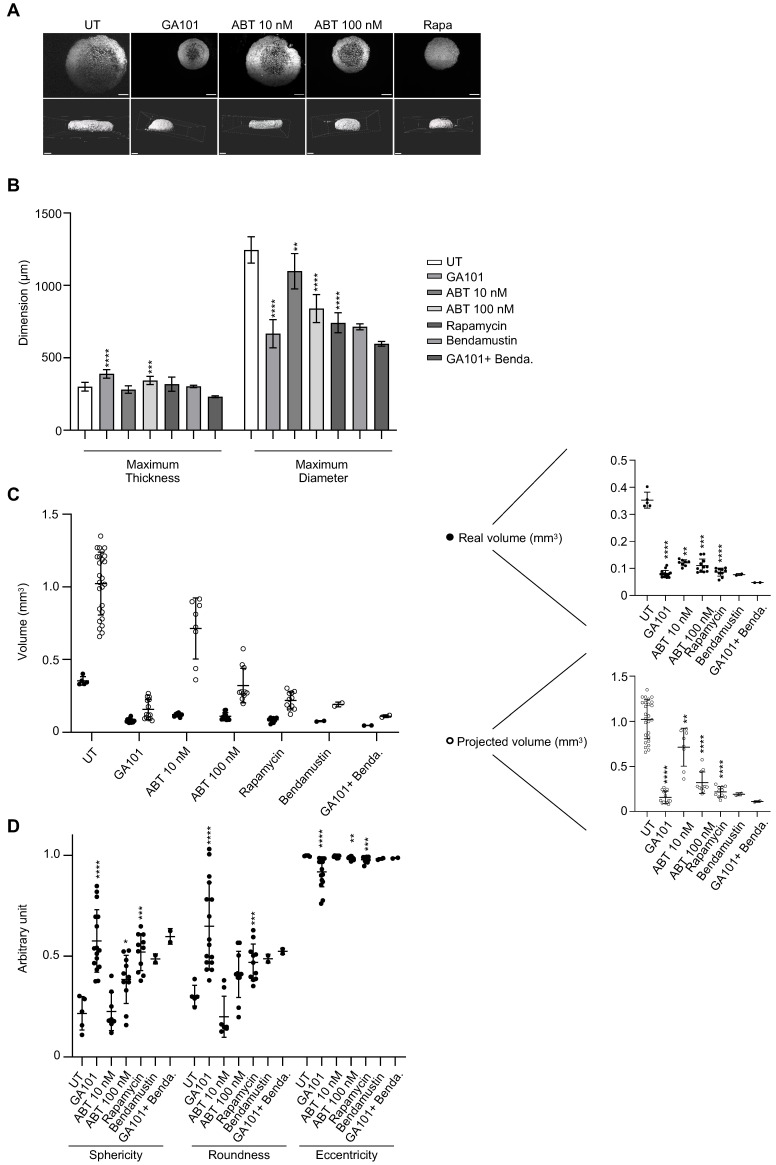
Follicular lymphoma (FL) is an indolent B cell lymphoproliferative disorder of transformed follicular center B cells, which accounts for 20-30 percent of all non-Hodgkin lymphoma (NHL) cases. Great advances have been made to identify the most relevant targets for precision therapy. However, no relevant models for in vitro studies have been developed or characterized in depth. To this purpose, we generated a 3D cell model from t(14;18)-positive B-NHL cell lines cultured in ultra-low attachment 96-well plates. Morphological features and cell growth behavior were evaluated by classical microscopy (2D imaging) and response to treatment with different drugs was evaluated by a high-content analysis system to determine the robustness of the model. We show that the ultra-low attachment (ULA) method allows the development of regular, spherical and viable ULA-multicellular aggregates of lymphoma cells (MALC). However, discrepancies in the results obtained after 2D imaging analyses on drug-treated ULA-MALC prompted us to develop 3D imaging and specific analyses. We show by using light sheet microscopy and specifically developed 3D imaging algorithms that 3D imaging and dedicated analyses are necessary to characterize morphological properties of 3D models and drug effects. This study proposes a new method, but also imaging tools and informatic solutions, developed for FL necessary for future preclinical studies.

Keywords: 2D imaging; 3D model; SPIM; drug testing; follicular lymphoma; spheroid.


Conflict of interest statement

R.M., M.N., A.G. and J.-M.L are employees of Imactiv3D.

Figures

Figure 1
Figure 1
Influence of cell density on ultra-low attachment (ULA)-multicellular aggregates of lymphoma cells (MALC) biology. ULA-MALC established with RL cells was cultured at different cell seeding densities (2500; 5000 and 10,000 cells) and different biological characteristics were determined at different culture times. (A) Growth and morphology observed by bright field (BF) microscopy at 4× after 3, 6 and 8 days (D) of culture. Scale: 500 µm. These pictures are representative of 3 independent experiments each comprising 6 individual ULA-MALC. (B) Morphological properties (projected area, sphericity, roundness and solidity) determined after 1, 3, 6 and 8 days (D) of culture by 2D imaging analysis with the specific macro developed (see Material and Methods section). These graphs are the mean ± SD of n = 3 independent experiments each comprising at least n = 10 individual ULA-MALC. (C) Cell death visualization and quantification on whole ULA-MALC at day 6 and 9 following propidium iodide (PI) labeling and 2D imaging. Experiment performed on 3 independent experiments each comprising 7 individual ULA-MALC. Upper panel, representative pictures of bright field (BF) or propidium iodide (PI) at 5× magnification, scale: 200 µm. Lower panel, mean ± SD of the ratio of area or intensity of propidium iodide (PI) in relation to the bright field (BF) area. (D) Cell death quantification by flow cytometry after 7AAD labeling of dissociated MALC. This graph represents mean ± SD of the percentage of cell death (7AAD+) measured in 3 independent experiments of 3 pooled ULA-MALC.
Figure 2
Figure 2
Two-dimensional characterization of ULA-MALC at 2500 cell seeding density. ULA-MALC established with RL cells were cultured at 2500 cell seeding density and observed at different times (D = day) by 2D imaging. (A) Upper panel, bright field (BF) pictures of ULA-MALC observed from day 0 to day 8 with an inverted microscope. Magnification 4×, scale 500 µm. Lower panel, ULA-MALC aggregation observed during the first 24 h at the indicated times (h = hour). Magnification: 4×, scale: 500 µm. Pictures are representative of 3 independent experiments each comprising 30 individual ULA-MALC. (B) ULA-MALC viability determined by Trypan blue exclusion assay. Results are expressed in percentage of viable cells in relation to day 0 (D0) and represent the mean ± SD of 3 independent experiments each comprising at least 11 individual ULA-MALC. (C) Living cells in ULA-MALC determined by Trypan blue exclusion assay. Results are expressed in number (Nb) of living cells per ULA-MALC and represent the mean ± SD of 3 independent experiments each comprising at least 11 individual ULA-MALC. Exact number of live cells is presented in the figure at each culture time. (D,E) Projected area (D) and diameter (E) of ULA-MALC measured at day 1, 3, 6 and 8 of culture by 2D imaging at 4× magnification. These graphs represent the mean ± SD of 3 independent experiments each comprising at least 30 individual ULA-MALC. (F) Ki67 labeling visualized 2D imaging (magnification 5×, scale: 200 µm) on whole ULA-MALC at day 3 and 6 of culture. Pictures are representative of 2 independent experiments each comprising 3 individual ULA-MALC.
Figure 3
Figure 3
Influence of cell density on drug response after 3 days of treatment. ULA-MALC were seeded at different cell densities (2500; 5000 and 10,000 cells) and treated or not (UT) at day 3 of culture with ABT-199 (ABT) at 10 nM and 100 nM. Cell death was visualized and measured 3 days post-treatment (i.e., D6 of culture). Results are representative (pictures) or the mean ± SD (graphs) of 3 independent experiments each comprising 5 individual ULA-MALC. p values: **** = p < 0.0001, *** = p < 0.0005 and ** = p < 0.01 (A) Global morphology (BF) and propidium iodide (PI) labeling were visualized by 2D imaging, 5× magnification and scale: 200 µm. (B) Bright field (BF) area measured after 3 days of treatment. Results represent the mean ± SD of the global BF area normalized to the untreated condition (UT). (C) Quantification of cell death after propidium iodide (PI) labeling on whole ULA-MALC cultured at 2500, 5000 and 10,000 cell seeding densities and treated or not (UT) with ABT-199. PI area in relation to BF area (left panel) and PI intensity in relation to BF area (right panel), all normalized to the untreated condition (UT). (D) Cell death measured by flow cytometry in dissociated ULA-MALC cultured at 2500, 5000 and 10,000 cell seeding densities and treated or not (UT) with ABT-199. Results represent the mean ± SD of the percentage of cell death (7AAD+).
Figure 4
Figure 4
Drug response of ULA-MALC after 3 days of treatment. ULA-MALC were seeded at 2500 cells and treated or not (UT) after 3 days of culture with rapamycin (Rapa, 10 nM), doxorubicin (Doxo, 0.1 µM), lenalidomide (Len, 5 µM), ibrutinib (Ibru, 500 nM), bendamustine (Benda, 10µg/mL) in combination or not with rituximab (RTX) or GA101 (10 µg/mL). ABT-199 (ABT) at 100 nM was used as the positive control. Figures represent results obtained after 3 days of treatment and are representative (pictures) or the mean ± SD (graphs) of 3 independent experiments each comprising 5 individual ULA-MALC. p values: **** = p < 0.0001, *** = p < 0.0005, ** = p < 0.01 and * = p < 0.05. (A) Visualization of global morphology (BF) and propidium iodide (PI) labeling by 2D imaging, 5× magnification and scale: 200 µm. (B) Bright field (BF) area and roundness determined by 2D imaging analysis with the specific macro developed (see the Methods section). Results represent the mean ± SD. (C) Cell death quantification after PI labeling by 2D imaging on whole ULA-MALC. Results represent the mean ± SD of PI area in relation to BF area (left) and PI intensity in relation to BF area (right), all normalized to the untreated condition. (D) Cell death quantification by flow cytometry in dissociated ULA-MALC. Results represent the mean ± SD of the percentage of cell death (7AAD+).
Figure 5
Figure 5
Three-dimensional characterization of ULA-MALC. ULA-MALC were cultured at a 2500 cell seeding density and observed at different times (D = day) by selective plane illumination microscope (SPIM) microscopy. (A) Pictures of center (upper panel) and 3D representation (lower panel) of ULA-MALC cultured during the indicated times (5× magnification, scale: 200 µm). These pictures are representative of 12–15 individual ULA-MALC (depending on the condition). (B) Quantification of maximum thickness and maximum diameter of ULA-MALC cultured during the indicated times. Histograms represent the mean ± SD of 12–15 individual ULA-MALC (depending on the condition). Insert, representative images of ULA-MALC at day 3 of culture (5× magnification, scale 200 µm). The white line represents the maximum thickness (upper) and maximum diameter (lower) used for quantification. (C) Ki67 labeling visualization by 3D imaging in ULA-MALC at day 3 of culture. Images were extracted from SPIM z-stack, from the bottom (left) to the top (right) of the MALC with a difference of 70 µm between them. Magnification 5×, scale: 200 µm. These pictures are representative of 2 independent experiments comprising 3 individual ULA-MALC. (D) Projected and real volumes of ULA-MALC after different days (D) of culture. Results are presented on global (left) or individual graphs (right) and are expressed by the mean ±SD of 5–15 individual ULA-MALC (depending on the condition). (E) Sphericity, roundness and eccentricity measured on ULA-MALC cultured during the indicated times (D = day). The graph represents the mean of each parameter ± SD of 5–15 individual ULA-MALC (depending on the condition).
Figure 6
Figure 6
Three-dimensional characterization of drug effect. ULA-MALC (2500 cell seeding density) at day 3 of culture were treated or not (UT) with GA101 (10 µg/mL), ABT-199 (ABT, 10 or 100 nM), rapamycin (Rapa 50 nM), bendamustine (Benda 10 nM) and observed after 3 days by SPIM microscopy. p values: **** = p < 0.0001, *** = p < 0.0005, ** = p < 0.01 and * = p < 0.05. Bendamustin and GA101 + Bendamustin conditions were excluded from statistical tests due to a low number of replicates (n = 2). (A) Pictures of center (upper) and 3D representation (lower) of ULA-MALC treated or not (UT) with the indicated drugs (5× magnification, scale: 200 µm). These pictures are representative of 5–6 independent experiments comprising 8–25 individual ULA-MALC (depending on the condition). (B) Quantification of maximum thickness and maximum diameter of treated or not (UT) ULA-MALC. Histograms are the mean ± SD of 1–6 independent experiments comprising 2–25 individual ULA-MALC (depending on the condition). (C) Projected and real volumes of ULA-MALC treated or not (UT) with different drugs. Results are presented on global (left) or individual graphs (right) and are the mean ± SD of 1–6 independent experiments comprising 2–25 individual ULA-MALC (depending on the condition). (D) Sphericity, roundness and eccentricity of ULA-MALC treated or not (UT) with different drugs. The graph represents the mean of each parameter ± SD of 1–6 independent experiments comprising 2–11 individual ULA-MALC (depending on the condition).

Similar articles

Cited by

References

    1. Carbone A., Roulland S., Gloghini A., Younes A., von Keudell G., López-Guillermo A., Fitzgibbon J. Follicular Lymphoma. Nat. Rev. Dis. Primers. 2019;5:83. doi: 10.1038/s41572-019-0132-x. - DOI - PubMed
    1. Dada R. Diagnosis and Management of Follicular Lymphoma: A Comprehensive Review. Eur. J. Haematol. 2019;103:152–163. doi: 10.1111/ejh.13271. - DOI - PubMed
    1. Pampaloni F., Reynaud E.G., Stelzer E.H.K. The Third Dimension Bridges the Gap between Cell Culture and Live Tissue. Nat. Rev. Mol. Cell Biol. 2007;8:839–845. doi: 10.1038/nrm2236. - DOI - PubMed
    1. Sutherland R.M., McCredie J.A., Inch W.R. Growth of Multicell Spheroids in Tissue Culture as a Model of Nodular Carcinomas. J. Natl. Cancer Inst. 1971;46:113–120. - PubMed
    1. Simian M., Bissell M.J. Organoids: A Historical Perspective of Thinking in Three Dimensions. J. Cell Biol. 2017;216:31–40. doi: 10.1083/jcb.201610056. - DOI - PMC - PubMed