. 2021 Mar 24;22(7):3310.
doi: 10.3390/ijms22073310.

Adenovirus Terminal Protein Contains a Bipartite Nuclear Localisation Signal Essential for Its Import into the Nucleus

Affiliations

Adenovirus Terminal Protein Contains a Bipartite Nuclear Localisation Signal Essential for Its Import into the Nucleus

Hareth A Al-Wassiti et al. Int J Mol Sci. .

Abstract

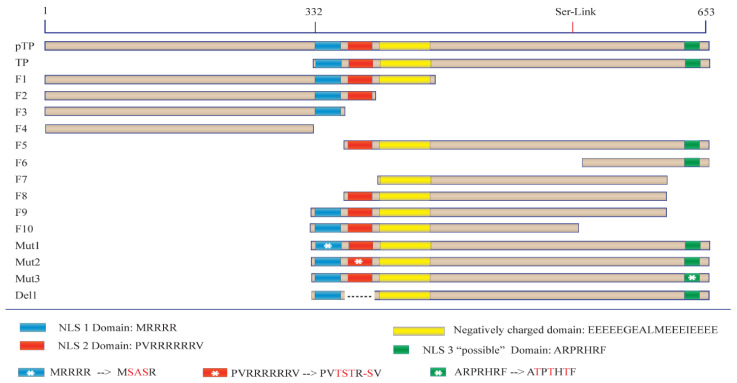
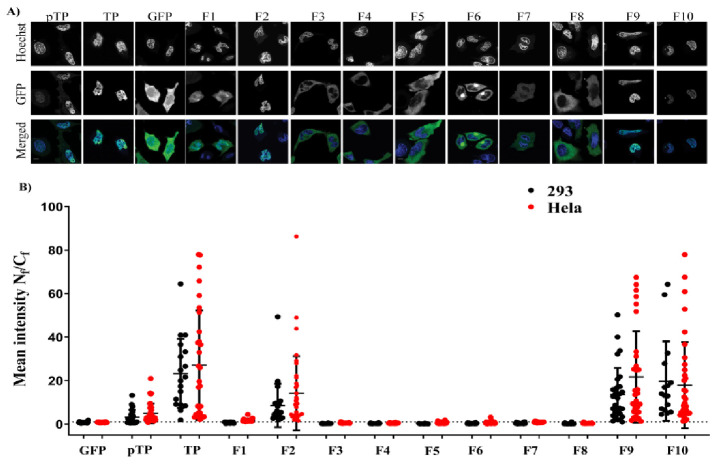
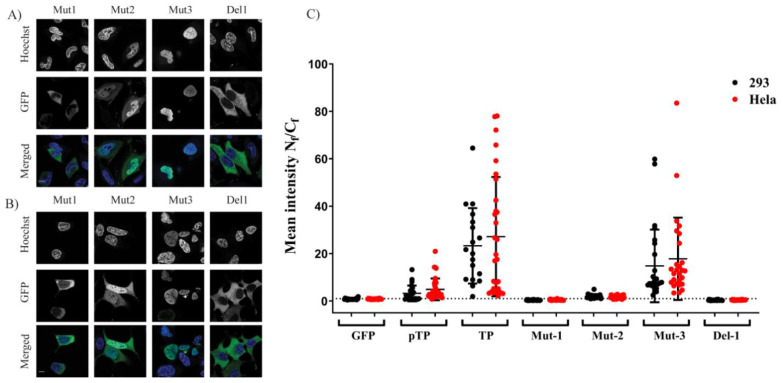
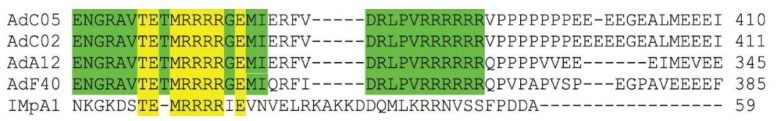
Adenoviruses contain dsDNA covalently linked to a terminal protein (TP) at the 5'end. TP plays a pivotal role in replication and long-lasting infectivity. TP has been reported to contain a nuclear localisation signal (NLS) that facilitates its import into the nucleus. We studied the potential NLS motifs within TP using molecular and cellular biology techniques to identify the motifs needed for optimum nuclear import. We used confocal imaging microscopy to monitor the localisation and nuclear association of GFP fusion proteins. We identified two nuclear localisation signals, PV(R)6VP and MRRRR, that are essential for fully efficient TP nuclear entry in transfected cells. To study TP-host interactions further, we expressed TP in Escherichia coli (E. coli). Nuclear uptake of purified protein was determined in digitonin-permeabilised cells. The data confirmed that nuclear uptake of TP requires active transport using energy and shuttling factors. This mechanism of nuclear transport was confirmed when expressed TP was microinjected into living cells. Finally, we uncovered the nature of TP binding to host nuclear shuttling proteins, revealing selective binding to Imp β, and a complex of Imp α/β but not Imp α alone. TP translocation to the nucleus could be inhibited using selective inhibitors of importins. Our results show that the bipartite NLS is required for fully efficient TP entry into the nucleus and suggest that this translocation can be carried out by binding to Imp β or Imp α/β. This work forms the biochemical foundation for future work determining the involvement of TP in nuclear delivery of adenovirus DNA.

Keywords: DNA binding proteins (DBP); DNA viruses; adenovirus; nuclear localisation signal (NLS); preterminal protein (pTP); terminal protein (TP); viral genome.


Conflict of interest statement

The authors declare no conflict of interest. The funders of H.A.A.-W.’s scholarship had no role in the design of the study; in the collection, analyses, or interpretation of data; in the writing of the manuscript, or in the decision to publish the results.

Figures

Figure 1
Figure 1
Fragmentation and mutation of preterminal protein (pTP) and terminal protein (TP). Fusion proteins were produced between the C–terminus of GFP and the N–terminus of TP fragments. The constructed fragments are shown with sublegends describing critical domains of interest and mutations are labelled with an asterisk. Ser-link represents the approximate position of the amino acid where TP binds to the viral genome. The starting amino acids of the open reading frame (ORF) is presented as 1 in the figure (see Section 4.1 in Materials and Methods). Mutation details are presented in the legend, and the dashed line signifies a deletion of wild-type amino acids.
Figure 2
Figure 2
Expression and localisation of pTP, TP, pMax, F1–F10 fragments. Plasmids containing the fragments fused to the C–terminal of GFP or GFP plasmid alone (designated pMax) were transfected into HeLa cells (A) Fragments: 1–10, GFP, TP and pTP. (B) The mean fluorescence intensity ratio between the nucleus and cytoplasm of the fused fragments. Total fluorescence in the nuclear region (Nf) and the cytoplasmic region (Cf) was measured and calculated as described in the Methods section and plotted as Nf/Cf values. Analysis of the graph was performed using one-way ANOVA followed by Tukey’s multiple comparisons analysis (details of the comparisons are described in Table S4 and Table S5). The dotted line represents an Nf/Cf value of 1. Each dot represents a single cell. Data were pooled from two separate transfections, and all plasmids were sequenced before transfections. The mean values and the exact number of replicates for each condition are described in Table S3. Each condition was represented by at least 15 cells. All data are represented as mean ± standard deviation. Scale bar = 10 µm.
Figure 3
Figure 3
Expression and localisation TP mutants. Specific locations in TP–GFP plasmid were either mutated or deleted as represented in Figure 1. HeLa (A) or 293A (B) cells were imaged and were presented as detailed in Figure 2 legend. Bar = 10 µM. (C) The mean fluorescence intensity ratio between the nucleus and cytoplasm of the mutants. Data were calculated and plotted similar to Figure 2B. Scale bar = 10 µM.
Figure 4
Figure 4
Protein sequence homology of the adenovirus bipartite nuclear localisation signal (NLS) and importin α. Sequence homology of amino acids in the NLS1 region of adenovirus TP and importin α is highlighted in yellow. Sequence homologies between different adenovirus serotypes around NLS1 and NLS2 are highlighted in green. Adenoviruses are represented as “Ad” followed by “C, A, or F” for the species designation and numbers representing the serotypes. Importin α is aligned for comparison. Homology was performed using the Uniprot alignment service.
Figure 5
Figure 5
Bacterially expressed TP–Trx or TP purification and characterisation. (A) FPLC diagram of TP–Trx elution from Histrap column with decreasing buffer A (i.e., increasing elution buffer B) shown in black and the relative absorbance at λ280 is shown in red. (B) SDS–page and Coomassie Blue staining of samples taken before and during TP purification. 1: TP in inclusion bodies; 2: flow-through; 3: wash; 4: elution (pooled). (C) Analysis of TP Western blotting. M: NIR ladder; 1: TP–Trx; 2: TPTrx after TEV enzyme cleavage; 3: TEV enzyme only. All wells were run in parallel using the same gel. The gel was cut in half. The first half was stained with Coomassie Blue (right image), and the other half was transferred into a PVDF membrane and stained with the antibody (left image) as described in the Methods section. Antibody staining of the membrane was performed using the Odyssey imaging system and Coomassie staining using Biorad Chemidoc imager.
Figure 6
Figure 6
TP–Trx is translocated into the nucleus using active transport that requires energy. (A) TP–Trx labelled with AF594 was incubated with cells permeabilised with digitonin for 30 min as described in the Methods section. Images were taken with laser confocal microscopy using the same imaging criteria across all conditions. AF488 (αDNA) was used to determine whether the nuclear membrane is compromised. The orange triangle shows an example of the compromised nucleus next to two cells with an uncompromised nuclear membrane. Those compromised nuclei were excluded from the analysis and calculations. E: energy; Cyto: rabbit reticulocyte lysate cytoplasm; WGA: wheat germ agglutinin. (B) Analysis of the mean fluorescence (AF594) intensity ratio (Nf/Cf) from DPA experiments. Data collected from fluorescence images in (A) were analysed using Image J as described in the Methods section and mean fluorescence intensities were plotted. The dotted line represents Nf/Cf of 1. Difference between conditions was analysed using ANOVA test with Tukey’s multiple comparisons as described in Table S7. Bars represent mean ± SD. N > 23. (C) Cytoplasmic microinjection of labelled TP–Trx–AF594 with BSA–FITC to serve as a cytoplasmic control. As an additional control, BSA–TxR was used instead of TP–Trx–AF594 and coinjected, cytoplasmically, with BSA–FITC. Images were taken approximately 30 min after microinjection of the proteins. (D) Nf/Cf ratios between TP–Trx injected compared to BSA control. Analysis of difference between the two conditions was conducted using Welch’s t–test with p–value < 0.0001. N > 50, mean ± SD. Scale bar = 10 µM.
Figure 7
Figure 7
TP–Trx binds to both Impβ1 and the Impα/β1 heterodimer and inhibitors of importins lower TP–Trx nuclear accumulation. (A) Triplicate wells containing 30 nM TP were incubated with increasing concentrations of Impα, Impβ1, Impα/β1 heterodimer, or a GST polypeptide control. Single representative curves are shown. As a control, the tags alone without TP were also tested and did not bind with Impα/β1 heterodimer or Impα using 60 nM concentrations of Trx tag. The tag has no binding affinity to both Imps. (B) Pooled data from AlphaScreens for binding affinities (Kd) and maximal binding (Bmax). Data are displayed as mean ± SEM (n = 4). ND, signals were too low to determine Kds. (C) Representative images from microinjection experiment described and quantified in (D). TP–Trx was microinjected using a combination of TP–Trx and BSA–FITC in Hela cells. Before microinjection, the cells were incubated for 3 h with either DMSO, or with ivermectin (30 µM), importazole (40 µM), and leptomycin (10 ng/ul). The microscopy images show a change of TP–Trx distribution using either ivermectin or importazole. Acquiring images started 20–30 min after microinjection. Scale bar = 15 µM. (D) Results from calculating TP Nf/Cf after microinjecting TP–Trx with BSA cytoplasmic marker. Cells were incubated with Leptomycin B (LepB), Importazole (ImpZ) or Ivermectin (Iver) or were examined in the absence of the drug. Graphs presented as mean± SD. Data were derived from at least two independent biological replicates (ncells ≥ 45). NS, not significant. *** is p–value = 0.0002 and **** is a p–value < 0.0001.

References

    1. Flatt J.W., Greber U.F. Misdelivery at the Nuclear Pore Complex—Stopping a Virus Dead in Its Tracks. Cells. 2015;4:277–296. doi: 10.3390/cells4030277. - DOI - PMC - PubMed
    1. Puntener D., Engelke M.F., Ruzsics Z., Strunze S., Wilhelm C., Greber U.F. Stepwise Loss of Fluorescent Core Protein V from Human Adenovirus during Entry into Cells. J. Virol. 2010;85:481–496. doi: 10.1128/JVI.01571-10. - DOI - PMC - PubMed
    1. Walkiewicz M.P., Morral N., Engel D.A. Accurate single-day titration of adenovirus vectors based on equivalence of protein VII nuclear dots and infectious particles. J. Virol. Methods. 2009;159:251–258. doi: 10.1016/j.jviromet.2009.04.010. - DOI - PMC - PubMed
    1. Robinson A.J., Bellett J.D. A circular DNA-protein complex adenoviruses and its possible role in DNA replication. Cold Spring Harb. Symp. Quant. Biol. 1975;39:523–531. doi: 10.1101/SQB.1974.039.01.064. - DOI - PubMed
    1. Webster A., Leith I.R., Nicholson J., Hounsell J., Hay R.T. Role of preterminal protein processing in adenovirus replication. J. Virol. 1997;71:6381–6389. doi: 10.1128/JVI.71.9.6381-6389.1997. - DOI - PMC - PubMed

LinkOut - more resources