

Musashi1 Contribution to Glioblastoma Development via Regulation of a Network of DNA Replication, Cell Cycle and Division Genes
- PMID: 33804958
- PMCID: PMC8036803
- DOI: 10.3390/cancers13071494
Musashi1 Contribution to Glioblastoma Development via Regulation of a Network of DNA Replication, Cell Cycle and Division Genes
Abstract
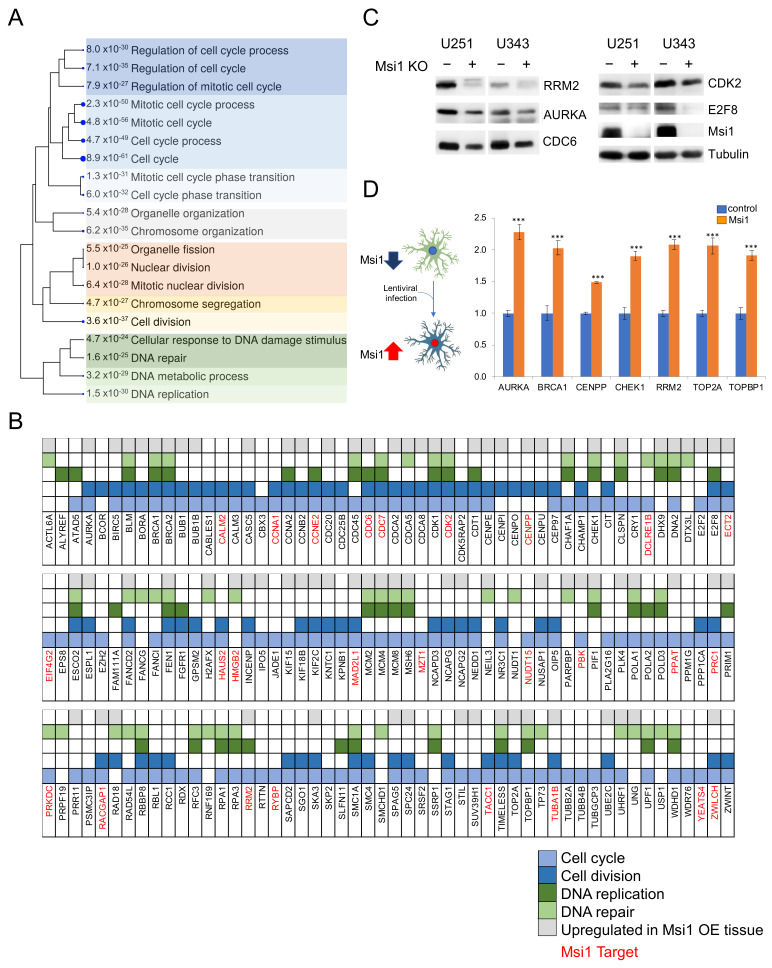
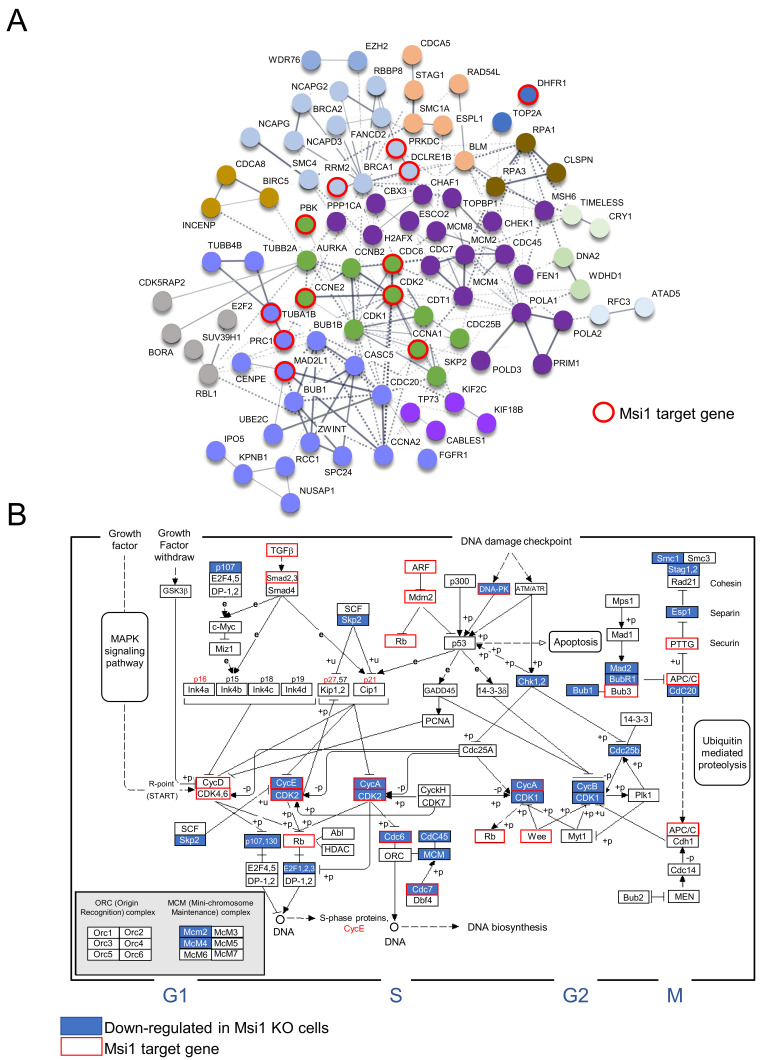
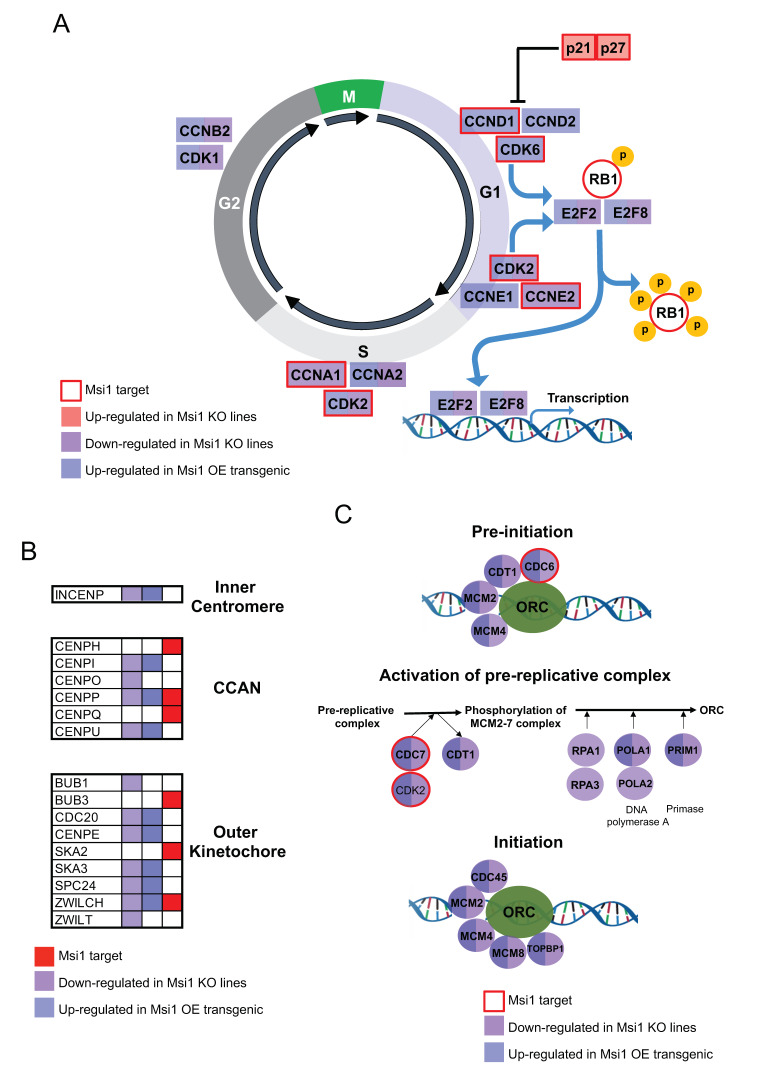
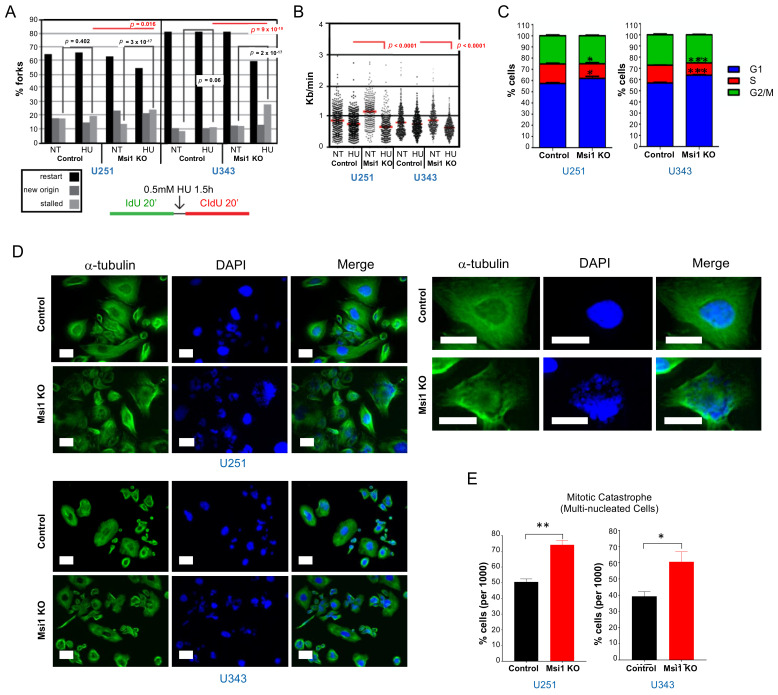
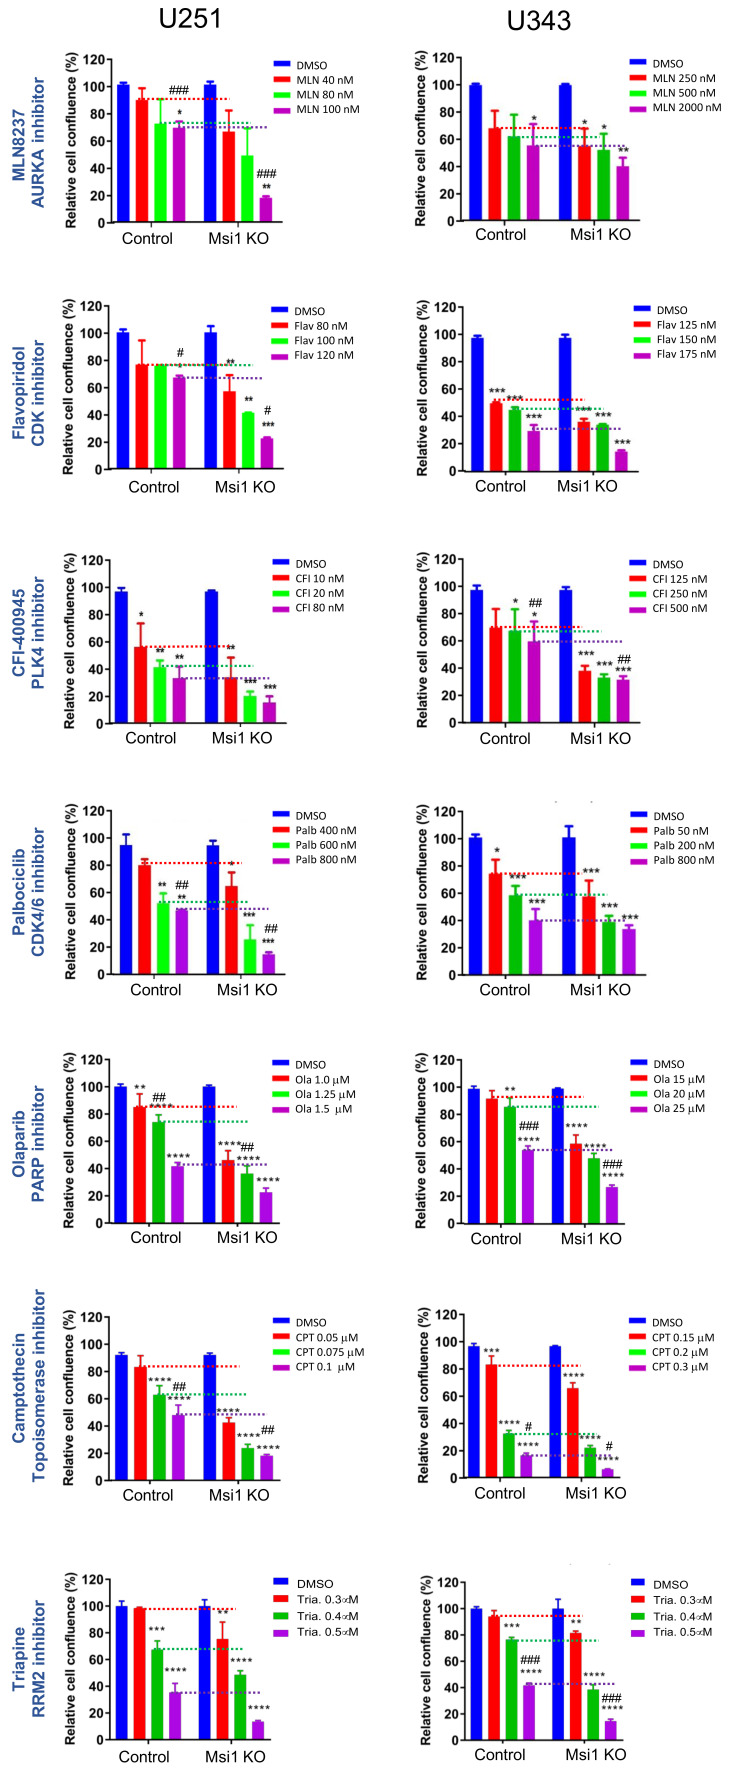
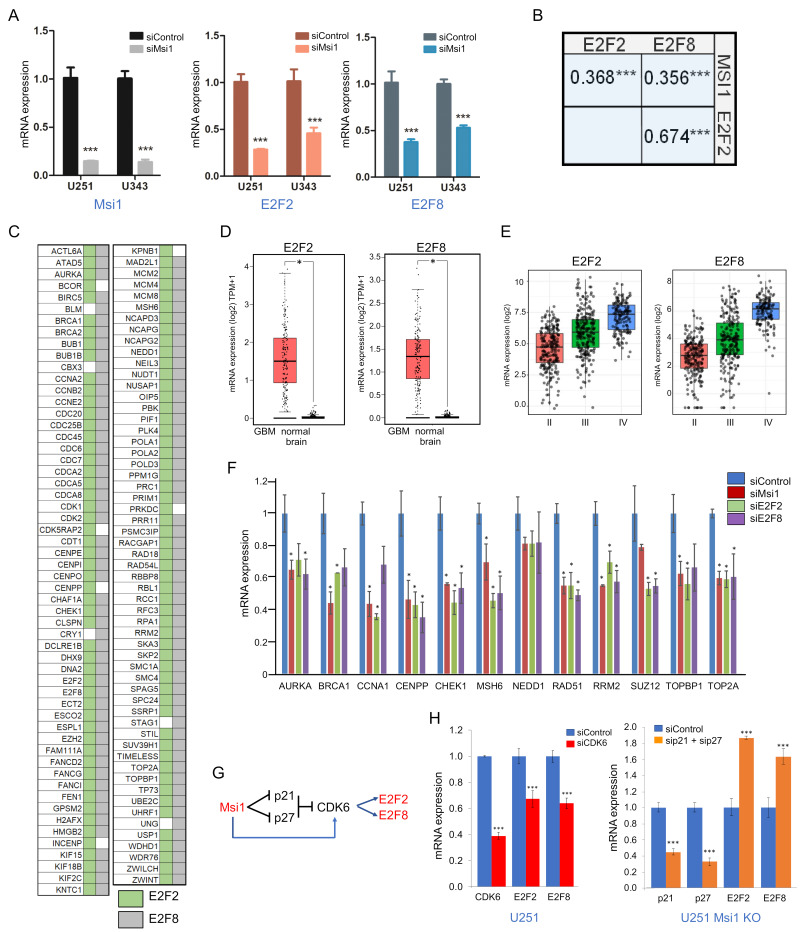
RNA-binding proteins (RBPs) function as master regulators of gene expression. Alterations in their levels are often observed in tumors with numerous oncogenic RBPs identified in recent years. Musashi1 (Msi1) is an RBP and stem cell gene that controls the balance between self-renewal and differentiation. High Msi1 levels have been observed in multiple tumors including glioblastoma and are often associated with poor patient outcomes and tumor growth. A comprehensive genomic analysis identified a network of cell cycle/division and DNA replication genes and established these processes as Msi1's core regulatory functions in glioblastoma. Msi1 controls this gene network via two mechanisms: direct interaction and indirect regulation mediated by the transcription factors E2F2 and E2F8. Moreover, glioblastoma lines with Msi1 knockout (KO) displayed increased sensitivity to cell cycle and DNA replication inhibitors. Our results suggest that a drug combination strategy (Msi1 + cell cycle/DNA replication inhibitors) could be a viable route to treat glioblastoma.
Keywords: DNA replication; E2F2; E2F8; Musashi1; cell cycle; cell division; glioblastoma.
Conflict of interest statement
The authors have declared that no competing interests exist.
Figures
Similar articles
-
Antagonism between the RNA-binding protein Musashi1 and miR-137 and its potential impact on neurogenesis and glioblastoma development.RNA. 2019 Jul;25(7):768-782. doi: 10.1261/rna.069211.118. Epub 2019 Apr 19. RNA. 2019. PMID: 31004009 Free PMC article.
-
Luteolin inhibits Musashi1 binding to RNA and disrupts cancer phenotypes in glioblastoma cells.RNA Biol. 2018;15(11):1420-1432. doi: 10.1080/15476286.2018.1539607. Epub 2018 Nov 18. RNA Biol. 2018. PMID: 30362859 Free PMC article.
-
Musashi1 Impacts Radio-Resistance in Glioblastoma by Controlling DNA-Protein Kinase Catalytic Subunit.Am J Pathol. 2016 Sep;186(9):2271-8. doi: 10.1016/j.ajpath.2016.05.020. Epub 2016 Jul 25. Am J Pathol. 2016. PMID: 27470713 Free PMC article.
-
Musashi1: an RBP with versatile functions in normal and cancer stem cells.Front Biosci (Landmark Ed). 2012 Jan 1;17(1):54-64. doi: 10.2741/3915. Front Biosci (Landmark Ed). 2012. PMID: 22201732 Review.
-
Musashi-1-A Stemness RBP for Cancer Therapy?Biology (Basel). 2021 May 5;10(5):407. doi: 10.3390/biology10050407. Biology (Basel). 2021. PMID: 34062997 Free PMC article. Review.
Cited by
-
Deciphering the role of transcription factors in glioblastoma cancer stem cells.Acta Biochim Biophys Sin (Shanghai). 2024 May 8;56(9):1245-1255. doi: 10.3724/abbs.2024061. Acta Biochim Biophys Sin (Shanghai). 2024. PMID: 38716541 Free PMC article. Review.
-
The RNA-Binding Protein Musashi1 Regulates a Network of Cell Cycle Genes in Group 4 Medulloblastoma.Cells. 2021 Dec 25;11(1):56. doi: 10.3390/cells11010056. Cells. 2021. PMID: 35011618 Free PMC article.
-
The Musashi-1-type 2 deiodinase pathway regulates astrocyte proliferation.J Biol Chem. 2024 Jul;300(7):107477. doi: 10.1016/j.jbc.2024.107477. Epub 2024 Jun 13. J Biol Chem. 2024. PMID: 38879014 Free PMC article.
-
Musashi-1 regulates cell cycle and confers resistance to cisplatin treatment in Group 3/4 medulloblastomas cells.Hum Cell. 2023 Nov;36(6):2129-2139. doi: 10.1007/s13577-023-00954-y. Epub 2023 Jul 17. Hum Cell. 2023. PMID: 37460706
-
Delivery of CRISPR-Cas9 system for screening and editing RNA binding proteins in cancer.Adv Drug Deliv Rev. 2022 Jan;180:114042. doi: 10.1016/j.addr.2021.114042. Epub 2021 Nov 9. Adv Drug Deliv Rev. 2022. PMID: 34767864 Free PMC article. Review.
References
-
- Vo D.T., Abdelmohsen K., Martindale J.L., Qiao M., Tominaga K., Burton T.L., Gelfond J.A., Brenner A.J., Patel V., Trageser D., et al. The oncogenic RNA-binding protein Musashi1 is regulated by HuR via mRNA translation and stability in glioblastoma cells. Mol. Cancer Res. 2012;10:143–155. doi: 10.1158/1541-7786.MCR-11-0208. - DOI - PMC - PubMed
-
- Uren P.J., Vo D.T., de Araujo P.R., Pötschke R., Burns S.C., Bahrami-Samani E., Qiao M., de Sousa Abreu R., Nakaya H.I., Correa B.R., et al. RNA-Binding Protein Musashi1 Is a Central Regulator of Adhesion Pathways in Glioblastoma. Mol. Cell. Biol. 2015;35:2965–2978. doi: 10.1128/MCB.00410-15. - DOI - PMC - PubMed
-
- Velasco M.X., Kosti A., Guardia G.D.A., Santos M.C., Tegge A., Qiao M., Correa B.R.S., Hernández G., Kokovay E., Galante P.A.F., et al. Antagonism between the RNA-binding protein Musashi1 and miR-137 and its potential impact on neurogenesis and glioblastoma development. RNA. 2019;25:768–782. doi: 10.1261/rna.069211.118. - DOI - PMC - PubMed
Grants and funding
LinkOut - more resources
Full Text Sources
Other Literature Sources
Molecular Biology Databases
Research Materials
