

The Actuation System of the Ankle Exoskeleton T-FLEX: First Use Experimental Validation in People with Stroke
- PMID: 33805216
- PMCID: PMC8064364
- DOI: 10.3390/brainsci11040412
The Actuation System of the Ankle Exoskeleton T-FLEX: First Use Experimental Validation in People with Stroke
Abstract
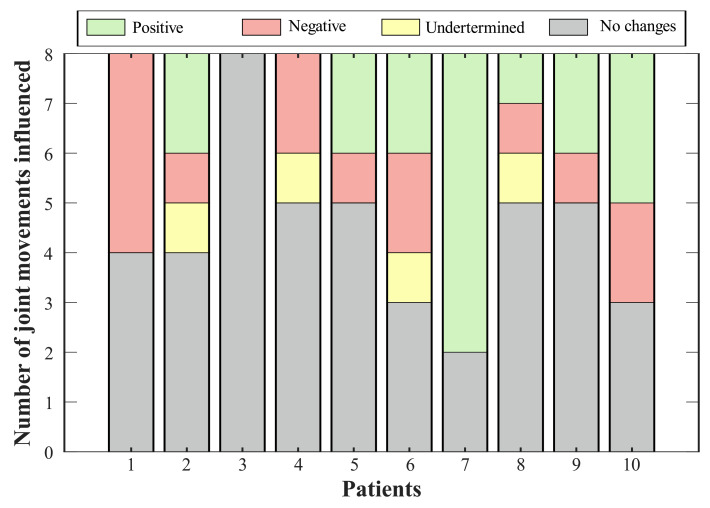
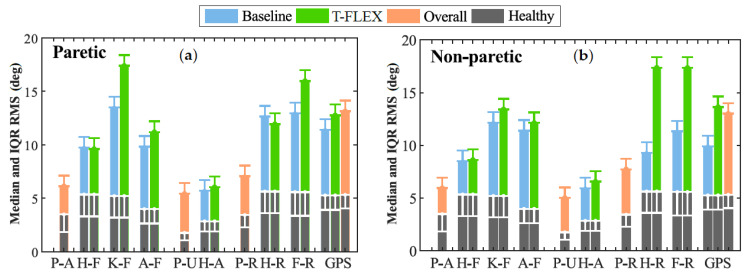
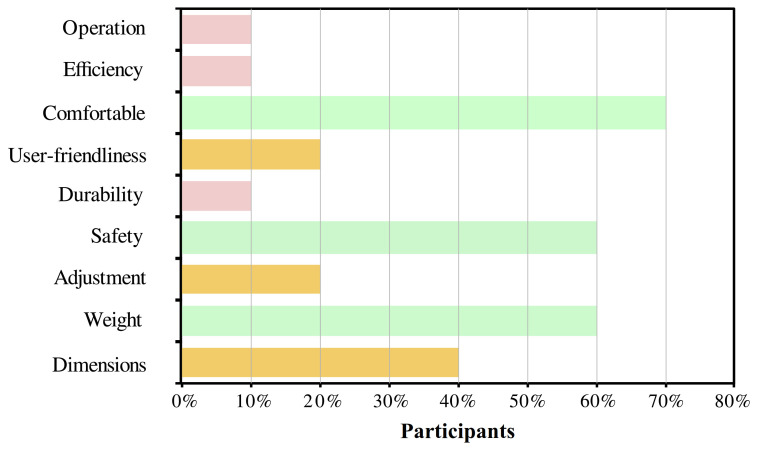
Robotic devices can provide physical assistance to people who have suffered neurological impairments such as stroke. Neurological disorders related to this condition induce abnormal gait patterns, which impede the independence to execute different Activities of Daily Living (ADLs). From the fundamental role of the ankle in walking, Powered Ankle-Foot Orthoses (PAFOs) have been developed to enhance the users' gait patterns, and hence their quality of life. Ten patients who suffered a stroke used the actuation system of the T-FLEX exoskeleton triggered by an inertial sensor on the foot tip. The VICONmotion capture system recorded the users' kinematics for unassisted and assisted gait modalities. Biomechanical analysis and usability assessment measured the performance of the system actuation for the participants in overground walking. The biomechanical assessment exhibited changes in the lower joints' range of motion for 70% of the subjects. Moreover, the ankle kinematics showed a correlation with the variation of other movements analyzed. This variation had positive effects on 70% of the participants in at least one joint. The Gait Deviation Index (GDI) presented significant changes for 30% of the paretic limbs and 40% of the non-paretic, where the tendency was to decrease. The spatiotemporal parameters did not show significant variations between modalities, although users' cadence had a decrease of 70% of the volunteers. Lastly, the satisfaction with the device was positive, the comfort being the most user-selected aspect. This article presents the assessment of the T-FLEX actuation system in people who suffered a stroke. Biomechanical results show improvement in the ankle kinematics and variations in the other joints. In general terms, GDI does not exhibit significant increases, and the Movement Analysis Profile (MAP) registers alterations for the assisted gait with the device. Future works should focus on assessing the full T-FLEX orthosis in a larger sample of patients, including a stage of training.
Keywords: Gait Deviation Index (GDI); Gait Profile Score (GPS); Movement Analysis Profile (MAP); Powered Ankle-Foot Orthosis (PAFO); ankle exoskeleton; biomechanical analysis; overground gait.
Conflict of interest statement
The authors declare that they have no competing interests.
Figures
Similar articles
-
Biomechanical Effects of Adding an Ankle Soft Actuation in a Unilateral Exoskeleton.Biosensors (Basel). 2022 Oct 14;12(10):873. doi: 10.3390/bios12100873. Biosensors (Basel). 2022. PMID: 36291010 Free PMC article.
-
Effects of the degree of freedom and assistance characteristics of powered ankle-foot orthoses on gait stability.PLoS One. 2020 Nov 10;15(11):e0242000. doi: 10.1371/journal.pone.0242000. eCollection 2020. PLoS One. 2020. PMID: 33170866 Free PMC article.
-
Mechanics and energetics of post-stroke walking aided by a powered ankle exoskeleton with speed-adaptive myoelectric control.J Neuroeng Rehabil. 2019 May 15;16(1):57. doi: 10.1186/s12984-019-0523-y. J Neuroeng Rehabil. 2019. PMID: 31092269 Free PMC article.
-
The gait and energy efficiency of stance control knee-ankle-foot orthoses: A literature review.Prosthet Orthot Int. 2016 Apr;40(2):202-14. doi: 10.1177/0309364615588346. Epub 2015 Jun 8. Prosthet Orthot Int. 2016. PMID: 26055252 Review.
-
The impact of ankle-foot orthosis stiffness on gait: A systematic literature review.Gait Posture. 2019 Mar;69:101-111. doi: 10.1016/j.gaitpost.2019.01.020. Epub 2019 Jan 15. Gait Posture. 2019. PMID: 30708092
Cited by
-
Biomechanical Effects of Adding an Ankle Soft Actuation in a Unilateral Exoskeleton.Biosensors (Basel). 2022 Oct 14;12(10):873. doi: 10.3390/bios12100873. Biosensors (Basel). 2022. PMID: 36291010 Free PMC article.
-
[Effects of ankle exoskeleton assistance during human walking on lower limb muscle contractions and coordination patterns].Sheng Wu Yi Xue Gong Cheng Xue Za Zhi. 2022 Feb 25;39(1):75-83. doi: 10.7507/1001-5515.202107040. Sheng Wu Yi Xue Gong Cheng Xue Za Zhi. 2022. PMID: 35231968 Free PMC article. Chinese.
-
A Robot-Assisted Therapy to Increase Muscle Strength in Hemiplegic Gait Rehabilitation.Front Neurorobot. 2022 Apr 29;16:837494. doi: 10.3389/fnbot.2022.837494. eCollection 2022. Front Neurorobot. 2022. PMID: 35574230 Free PMC article.
-
Application of Wearable Sensors in Actuation and Control of Powered Ankle Exoskeletons: A Comprehensive Review.Sensors (Basel). 2022 Mar 14;22(6):2244. doi: 10.3390/s22062244. Sensors (Basel). 2022. PMID: 35336413 Free PMC article. Review.
-
Effects of powered ankle-foot orthoses mass distribution on lower limb muscle forces-a simulation study.Med Biol Eng Comput. 2023 May;61(5):1167-1182. doi: 10.1007/s11517-023-02778-2. Epub 2023 Jan 23. Med Biol Eng Comput. 2023. PMID: 36689083 Free PMC article.
References
-
- Feigin V.L., Nichols E., Alam T., Bannick M.S., Beghi E., Blake N., Fischer F., Murray C.J.L., Zhang Y., Violante F.S., et al. Global, regional, and national burden of neurological disorders, 1990–2016: A systematic analysis for the Global Burden of Disease Study 2016. Lancet Neurol. 2019;18:459–480. doi: 10.1016/S1474-4422(18)30499-X. - DOI - PMC - PubMed
-
- Nadeau S., Duclos C., Bouyer L., Richards C.L. Guiding task-oriented gait training after stroke or spinal cord injury by means of a biomechanical gait analysis. Prog. Brain Res. 2011;192:161–180. - PubMed
Grants and funding
LinkOut - more resources
Full Text Sources
Other Literature Sources
Medical
