

Transcriptional Dynamics of Genes Purportedly Involved in the Control of Meiosis, Carbohydrate, and Secondary Metabolism during Sporulation in Ganoderma lucidum
- PMID: 33805512
- PMCID: PMC8066989
- DOI: 10.3390/genes12040504
Transcriptional Dynamics of Genes Purportedly Involved in the Control of Meiosis, Carbohydrate, and Secondary Metabolism during Sporulation in Ganoderma lucidum
Abstract
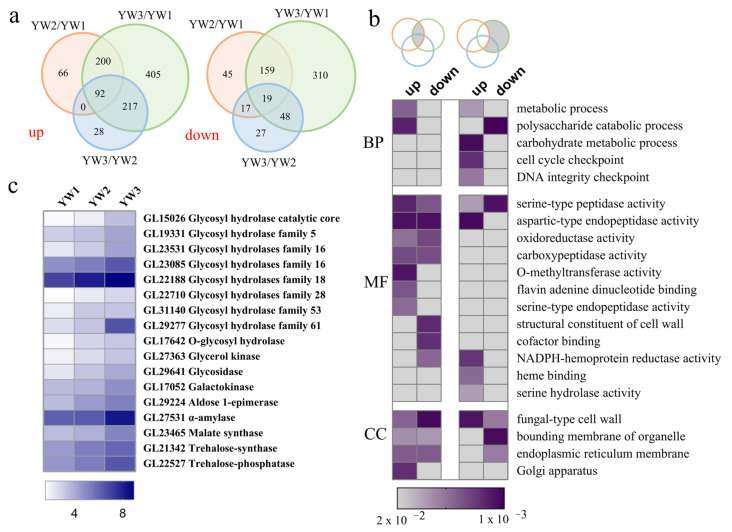
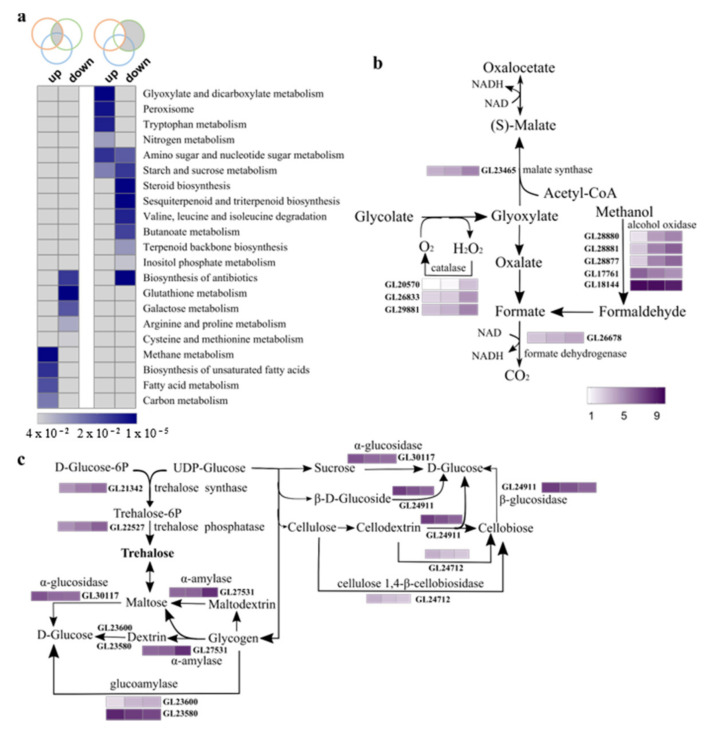
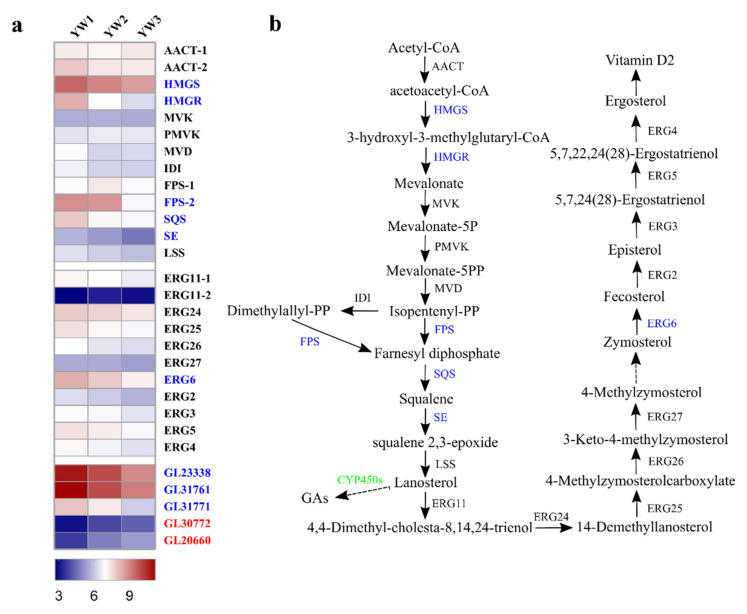
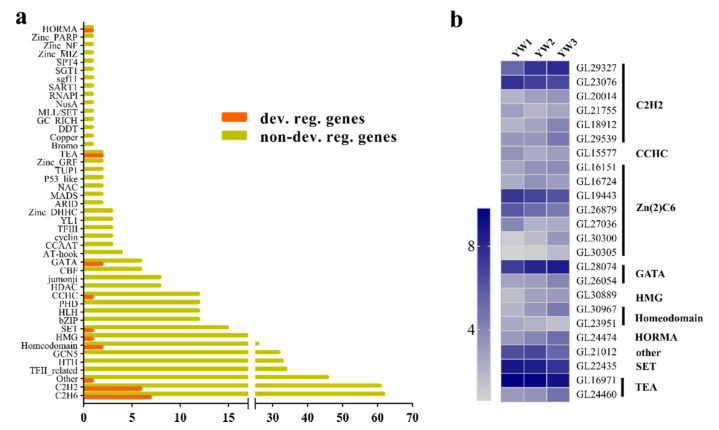
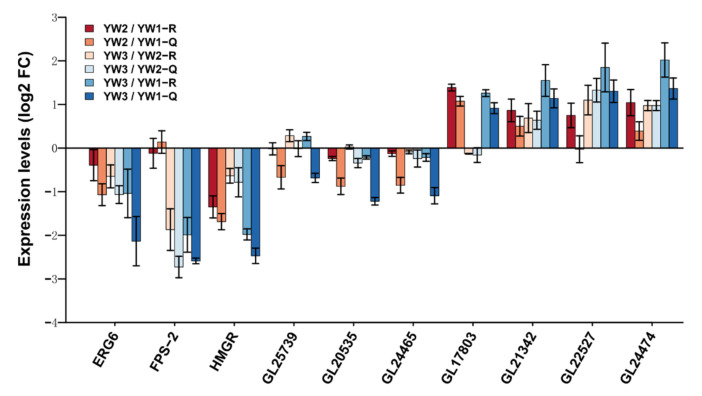
Ganoderma lucidum spores (GLS), the mature germ cells ejected from the abaxial side of the pileus, have diverse pharmacological effects. However, the genetic regulation of sporulation in this fungus remains unknown. Here, samples corresponding to the abaxial side of the pileus were collected from strain YW-1 at three sequential developmental stages and were then subjected to a transcriptome assay. We identified 1598 differentially expressed genes (DEGs) and found that the genes related to carbohydrate metabolism were strongly expressed during spore morphogenesis. In particular, genes involved in trehalose and malate synthesis were upregulated, implying the accumulation of specific carbohydrates in mature G. lucidum spores. Furthermore, the expression of genes involved in triterpenoid and ergosterol biosynthesis was high in the young fruiting body but gradually decreased with sporulation. Finally, spore development-related regulatory pathways were explored by analyzing the DNA binding motifs of 24 transcription factors that are considered to participate in the control of sporulation. Our results provide a dataset of dynamic gene expression during sporulation in G. lucidum. They also shed light on genes potentially involved in transcriptional regulation of the meiotic process, metabolism pathways in energy provision, and ganoderic acids and ergosterol biosynthesis.
Keywords: Ganoderma lucidum; energy source; meiotic process; sporulation; transcription regulation.
Conflict of interest statement
The authors declare no conflict of interest.
Figures

Similar articles
-
Comparative transcriptome analysis of genes and metabolic pathways involved in sporulation in Ganoderma lingzhi.G3 (Bethesda). 2022 Mar 4;12(3):jkab448. doi: 10.1093/g3journal/jkab448. G3 (Bethesda). 2022. PMID: 35079793 Free PMC article.
-
Comparative transcriptome analysis revealed candidate genes involved in fruiting body development and sporulation in Ganoderma lucidum.Arch Microbiol. 2022 Jul 22;204(8):514. doi: 10.1007/s00203-022-03088-1. Arch Microbiol. 2022. PMID: 35867171
-
Integrative Analysis of Selected Metabolites and the Fungal Transcriptome during the Developmental Cycle of Ganoderma lucidum Strain G0119 Correlates Lignocellulose Degradation with Carbohydrate and Triterpenoid Metabolism.Appl Environ Microbiol. 2021 Jun 11;87(13):e0053321. doi: 10.1128/AEM.00533-21. Epub 2021 Jun 11. Appl Environ Microbiol. 2021. PMID: 33893114 Free PMC article.
-
Shedding light on the mechanisms underlying the environmental regulation of secondary metabolite ganoderic acid in Ganoderma lucidum using physiological and genetic methods.Fungal Genet Biol. 2019 Jul;128:43-48. doi: 10.1016/j.fgb.2019.03.009. Epub 2019 Apr 2. Fungal Genet Biol. 2019. PMID: 30951869 Review.
-
Meiosis: step-by-step through sporulation.Curr Biol. 1998 Jun 18;8(13):R461-3. doi: 10.1016/s0960-9822(98)70293-3. Curr Biol. 1998. PMID: 9651674 Review.
Cited by
-
Whole-genome assembly of Ganoderma leucocontextum (Ganodermataceae, Fungi) discovered from the Tibetan Plateau of China.G3 (Bethesda). 2021 Dec 8;11(12):jkab337. doi: 10.1093/g3journal/jkab337. G3 (Bethesda). 2021. PMID: 34586388 Free PMC article.
-
Comparative transcriptome analysis of genes and metabolic pathways involved in sporulation in Ganoderma lingzhi.G3 (Bethesda). 2022 Mar 4;12(3):jkab448. doi: 10.1093/g3journal/jkab448. G3 (Bethesda). 2022. PMID: 35079793 Free PMC article.
-
A Review of Genomic, Transcriptomic, and Proteomic Applications in Edible Fungi Biology: Current Status and Future Directions.J Fungi (Basel). 2025 May 30;11(6):422. doi: 10.3390/jof11060422. J Fungi (Basel). 2025. PMID: 40558935 Free PMC article. Review.
-
Unraveling bioactive potential and production in Ganoderma lucidum through omics and machine learning modeling.Chin Herb Med. 2025 May 19;17(3):414-427. doi: 10.1016/j.chmed.2025.05.003. eCollection 2025 Jul. Chin Herb Med. 2025. PMID: 40734909 Free PMC article. Review.
-
Sexual spores in mushrooms: bioactive compounds, factors and molecular mechanisms of spore formation.Arch Microbiol. 2025 Jan 21;207(2):38. doi: 10.1007/s00203-024-04220-z. Arch Microbiol. 2025. PMID: 39836288 Review.
References
-
- Soccol C.R., Bissoqui L.Y., Rodrigues C., Rubel R., Sella S.R., Leifa F., Vandenberghe L.P.D.S., Soccol V.T. Pharmacological Properties of Biocompounds from Spores of the Lingzhi or Reishi Medicinal Mushroom Ganoderma lucidum (Agaricomycetes): A Review. Int. J. Med. Mushrooms. 2016;18:757–767. doi: 10.1615/IntJMedMushrooms.v18.i9.10. - DOI - PubMed
-
- Xie C., Yan S., Zhang Z., Gong W., Zhu Z., Zhou Y., Yan L., Hu Z., Ai L., Peng Y. Mapping the metabolic signatures of fermentation broth, mycelium, fruiting body and spores powder from Ganoderma lucidum by untargeted metabolomics. LWT. 2020;129:109494. doi: 10.1016/j.lwt.2020.109494. - DOI
Publication types
MeSH terms
Substances
LinkOut - more resources
Full Text Sources
Other Literature Sources
Miscellaneous
