. 2021 Mar 29;10(4):535.
doi: 10.3390/antiox10040535.

Dietary Marginal and Excess Selenium Increased Triglycerides Deposition, Induced Endoplasmic Reticulum Stress and Differentially Influenced Selenoproteins Expression in the Anterior and Middle Intestines of Yellow Catfish Pelteobagrus fulvidraco

Affiliations

Dietary Marginal and Excess Selenium Increased Triglycerides Deposition, Induced Endoplasmic Reticulum Stress and Differentially Influenced Selenoproteins Expression in the Anterior and Middle Intestines of Yellow Catfish Pelteobagrus fulvidraco

Dian-Guang Zhang et al. Antioxidants (Basel). .

Abstract

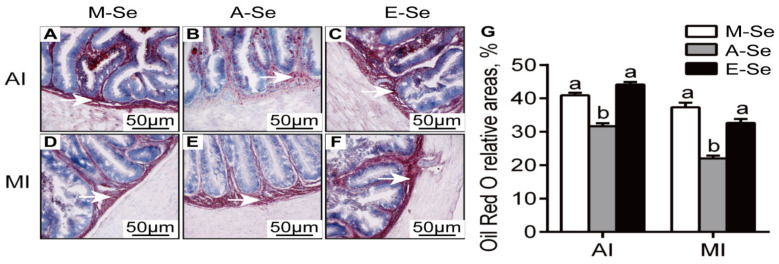
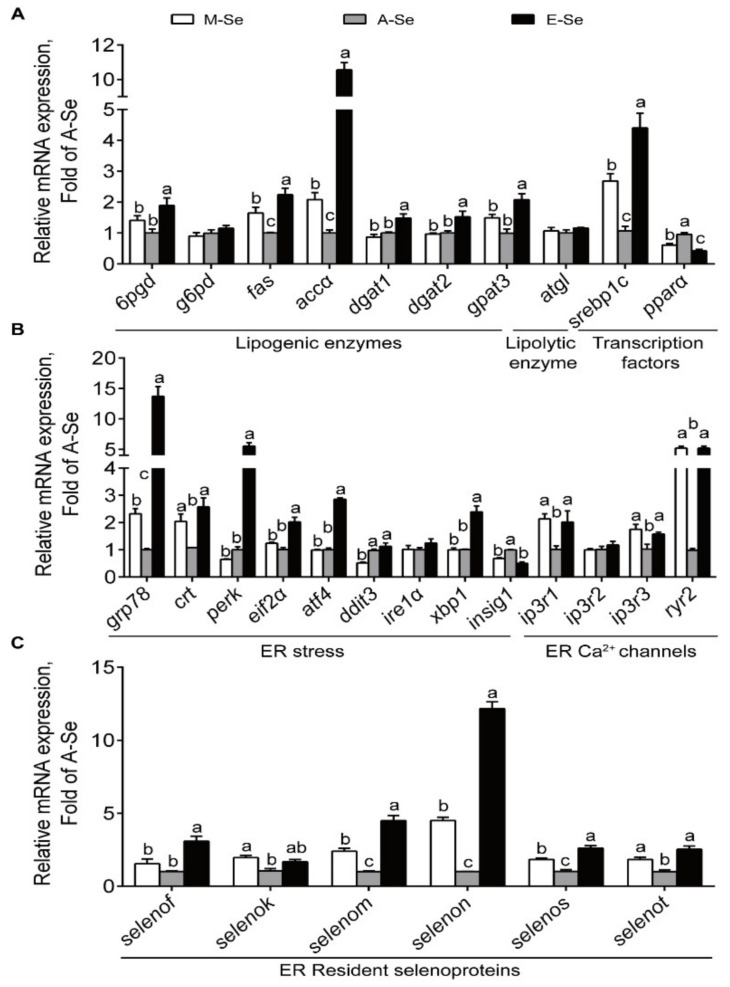
Selenium (Se) is an essential micro-mineral and plays important roles in antioxidant responses, and also influences lipid metabolism and selenoprotein expression in vertebrates, but the effects and mechanism remain unknown. The study was undertaken to decipher the insights into dietary Se influencing lipid metabolism and selenoprotein expression in the anterior and middle intestine (AI and MI) of yellow catfish Pelteobagrus fulvidraco. Yellow catfish (weight: 8.27 ± 0.03 g) were fed a 0.03- (M-Se), 0.25- (A-Se), or 6.39- (E-Se) mg Se/kg diet for 12 wk. AI and MI were analyzed for triglycerides (TGs) and Se concentrations, histochemistry and immunofluorescence, enzyme activities, and gene and protein levelsassociated with antioxidant responses, lipid metabolism, endoplasmic reticulum (ER) stress, and selenoproteome. Compared to the A-Se group, M-Se and E-Se diets significantly decreased weight gain (WG) and increased TGs concentration in the AI and MI. In the AI, compared with A-Se group, M-Se and E-Se diets significantly increased activities of fatty acid synthase, expression of lipogenic genes, and suppressed lipolysis. In the MI, compared to the A-Se group, M-Se and E-Se diets significantly increased activities of lipogenesis and expression of lipogenic genes. Compared with A-Se group, E-Se diet significantly increased glutathione peroxidase (GPX) activities in the AI and MI, and M-Se diet did not significantly reduce GPX activities in the AI and MI. Compared with the A- Se group, E-Se diet significantly increased glutathione peroxidase (GPX) activities in the plasma and liver, and M-Se diet significantly reduced GPX activities in the plasma and liver. Compared with the A-Se group, M-Se and E-Se groups also increased glucose-regulated protein 78 (GRP78, ER stress marker) protein expression of the intestine. Dietary Se supplementation also differentially influenced the expression of the 28 selenoproteins in the AI and MI, many of which possessed antioxidant characteristics. Compared with the A-Se group, the M-Se group significantly decreased mRNA levels of txnrd2 and txnrd3, but made no difference on mRNA levels of these seven GPX proteins in the MI. Moreover, we characterized sterol regulatory element binding protein 1c (SREBP1c) binding sites of three ER-resident proteins (selenom, selenon, and selenos) promoters, and found that Se positively controlled selenom, selenon, and selenos expression via SREBP1c binding to the selenom, selenon, and selenos promoter. Thus, dietary marginal and excess Se increased TGs deposition of yellow catfish P. fulvidraco, which might be mediated by ER-resident selenoproteins expression and ER stress.

Keywords: endoplasmic reticulum stress; lipid metabolism; selenium; selenotranscriptome; transcription regulation; vertebrates.


Conflict of interest statement

The authors declare no conflict of interest.

Figures

Figure 1
Figure 1
GPX activities in the plasma and liver of yellow catfish fed diets varying in Se level for 12 wk. Values are means ± SEMs, n = 3 (replicates of 3 fish). Labeled means without a common letter differ, p < 0.05 (one-factor ANOVA, Duncan post hoc test). GPX, glutathione peroxidase.
Figure 2
Figure 2
Effects of dietary Se supplementation on the histochemistry (Oil Red O staining, original magnification 200×) of anterior intestine (AI) (AC) and middle intestine (MI) (DF) in yellow catfish. Relative areas for lipid droplets in Oil Red O staining (G). White arrows point to red dot (lipid droplet). Values are mean ± SEM, n = 3 (replicates of 3 fish). Labeled means without a common letter differ, p < 0.05 (one-factor ANOVA, Duncan post hoc test).
Figure 3
Figure 3
AI and MI TGs concentration (A) and Se content (B) in yellow catfish fed diets varying in Se level for 12 wk. Values are means ± SEMs, n = 3 (replicates of 3 fish). Labeled means without a common letter differ, p < 0.05 (one-factor ANOVA, Duncan post hoc test).
Figure 4
Figure 4
Lipid metabolism-related enzymatic activities and GPX activities in the AI and MI of yellow catfish fed diets varying in Se level for 12 wk. Values are means ± SEMs, n = 3 (replicates of 3 fish). Labeled means without a common letter differ, p < 0.05 (one-factor ANOVA, Duncan post hoc test). 6PGD, 6-phosphogluconate dehydrogenase; AI, anterior intestine; FAS, fatty acid synthase; G6PD, glucose 6-phosphate dehydrogenase; GPX, glutathione peroxidase; ICDH, isocitrate dehydrogenase; ME, malic enzyme; MI, middle intestine.
Figure 5
Figure 5
Relative mRNA levels of lipid metabolism (A), ER stress and ER Ca2+ channels (B), related genes and selenoproteins (C) in the AI of yellow catfish fed diets varying in Se level for 12 wk. Values are means ± SEMs, n = 3 (replicates of 3 fish). Labeled means without a common letter differ, p < 0.05 (one-factor ANOVA, Duncan post hoc test).
Figure 6
Figure 6
Relative mRNA levels of lipid metabolism (A), ER stress and ER Ca2+ channels (B), related genes and selenoproteins (C) in the MI of yellow catfish fed diets varying in Se level for 12 wk. Values are means ± SEMs, n = 3 (replicates of 3 fish). Labeled means without a common letter differ, p < 0.05 (one-factor ANOVA, Duncan post hoc test).
Figure 7
Figure 7
Relative protein expression of intestine SREBP1c and ACCα (A,B) and SELENOF, SELENON, and SELENOS (C,D) in yellow catfish fed diets varying in Se level for 12 wk. GAPDH was used as internal standard. Values are means ± SEMs, n = 3 (replicates of 3 fish). Labeled means without a common letter differ, p < 0.05 (one-factor ANOVA, Duncan post hoc test).
Figure 8
Figure 8
Cell viability (A), selenos promoter activity assays (BD), SREBP1c protein expression (E), and EMSA analysis (F) in the experiment 2. Values are means ± SEMs, n = 3. * Different from control, p < 0.05 (Student’s t test) and # Different from wild plasmid, p < 0.05 (Student’s t test).
Figure 9
Figure 9
selenom promoter activity assays (AC) and EMSA analysis (D) in the experiment 2. Values are means ± SEMs, n = 3. * Different from control, p < 0.05 (Student’s t test) and # Different from wild plasmid, p < 0.05 (Student’s t test).
Figure 10
Figure 10
selenon promoter activity assays (AC) and EMSA analysis (D) in the experiment 2. Values are means ± SEMs, n = 3. * Different from control, p < 0.05 (Student’s t test) and # Different from wild plasmid, p < 0.05 (Student’s t test).

Similar articles

Cited by

References

    1. Labunskyy V.M., Hatfield D.L., Gladyshev V.N. Selenoproteins: Molecular pathways and physiological roles. Physiol. Rev. 2014;94:739–777. doi: 10.1152/physrev.00039.2013. - DOI - PMC - PubMed
    1. Ogawa-Wong A.N., Berry M.J., Seale L.A. Selenium and Metabolic Disorders: An Emphasis on Type 2 Diabetes Risk. Nutrients. 2016;8:80. doi: 10.3390/nu8020080. - DOI - PMC - PubMed
    1. Zhou J.C., Zhao H., Li J.G., Xia X.J., Wang K.N., Zhang Y.J., Liu Y., Zhao Y., Lei X.G. Selenoprotein gene expression in thyroid and pituitary of young pigs is not affected by dietary selenium deficiency or excess. J. Nutr. 2009;139:1061–1066. doi: 10.3945/jn.109.104901. - DOI - PMC - PubMed
    1. Yan X., Pepper M.P., Vatamaniuk M.Z., Roneker C.A., Li L., Lei X.G. Dietary selenium deficiency partially rescues type 2 diabetes-like phenotypes of glutathione peroxidase-1-overexpressing male mice. J. Nutr. 2012;142:1975–1982. doi: 10.3945/jn.112.164764. - DOI - PMC - PubMed
    1. Zhao Z., Kim J., Lei X.G. High dietary fat and selenium concentrations exert tissue- and glutathione peroxidase 1-dependent impacts on lipid metabolism of young-adult mice. J. Nutr. 2020;150:1738–1748. doi: 10.1093/jn/nxaa130. - DOI - PMC - PubMed

LinkOut - more resources