. 2021 Mar 29;11(4):291.
doi: 10.3390/life11040291.

Priming by High Temperature Stress Induces MicroRNA Regulated Heat Shock Modules Indicating Their Involvement in Thermopriming Response in Rice

Affiliations

Priming by High Temperature Stress Induces MicroRNA Regulated Heat Shock Modules Indicating Their Involvement in Thermopriming Response in Rice

Akhilesh Kumar Kushawaha et al. Life (Basel). .

Abstract

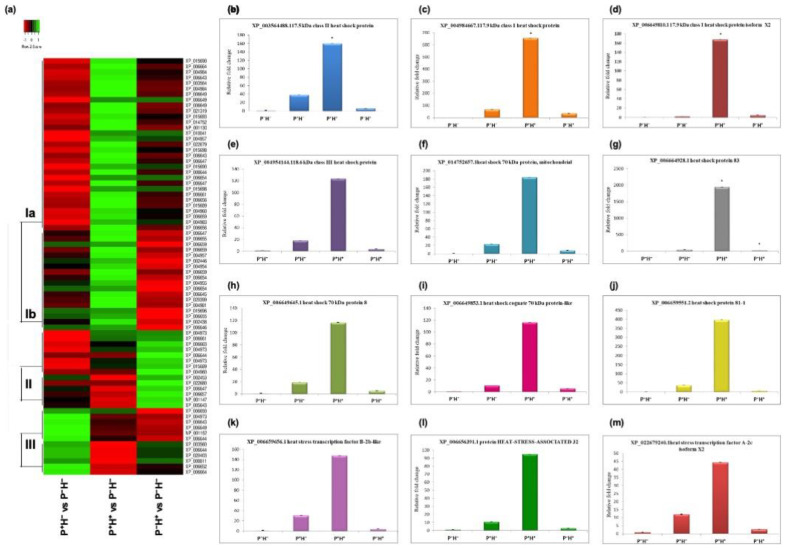
Rice plants often encounter high temperature stress, but the associated coping strategies are poorly understood. It is known that a prior shorter exposure to high temperature, called thermo-priming, generally results in better adaptation of the plants to subsequent exposure to high temperature stress. High throughput sequencing of transcript and small RNA libraries of rice seedlings primed with short exposure to high temperature followed by high temperature stress and from plants exposed to high temperature without priming was performed. This identified a number of transcripts and microRNAs (miRs) that are induced or down regulated. Among them osa-miR531b, osa-miR5149, osa-miR168a-5p, osa-miR1846d-5p, osa-miR5077, osa-miR156b-3p, osa-miR167e-3p and their respective targets, coding for heat shock activators and repressors, showed differential expression between primed and non-primed plants. These findings were further validated by qRT-PCR. The results indicate that the miR-regulated heat shock proteins (HSPs)/heat shock transcription factors (HSFs) may serve as important regulatory nodes which are induced during thermo-priming for plant survival and development under high temperatures.

Keywords: HSF; HSP; RNA-seq; high temperature stress; interactome; microRNA; thermo-priming.


Conflict of interest statement

The authors declare no competing financial interests.

Figures

Figure 1
Figure 1
Treatment protocol for high temperature (HT) priming and stress provided to four groups of 15-day-old rice plants. Arrows indicate the time points at which the samples were harvested for each set. (a) HT priming was done by gradually increasing the temperature from 28 °C to 38 °C in steps of 45 min each and keeping at 38 °C for 90 min. This was followed by reverting the plants to 28 °C for two days and then providing high temperature stress (HTS) at 42 °C for 90 min. Plants growing at 28 °C served as the control (PH) for each set. The second group was only primed with HT (P+H). The third group was primed with HT and then exposed to HTS (P+H+). (b) The fourth group of plants were directly exposed to HTS at 42 °C for 90 min (PH+). Each experiment was performed in triplicate using three batches of plants in each group.
Figure 2
Figure 2
Representation of differentially expressed transcripts (DETs) in datasets obtained from rice seedlings only primed with HT (P+H), thermo-priming followed by HTS (P+H+) and plants exposed directly to HTS without thermo-priming (PH+). In each case, the differential expression was calculated with respect to control non-primed plants (PH). (a) Venn diagram to show the number of unique and overlapping DETs. The number of transcripts that are up regulated (shown by green triangles) or down regulated (shown by red triangles) at least two-fold are also shown. (b) The comparison of fold deregulations with the number of DETs represented as percentage stacked columns.
Figure 3
Figure 3
Graphical plot to represent the significantly enriched Gene Ontology (GO) categories in data sets obtained from rice seedlings only primed with HT (P+H), thermo-priming followed by HTS (P+H+) and plants exposed directly to HTS without thermo-priming (PH+). (a) In each case, the differential expression was calculated with respect to control non-primed plants (PH). (b) The differential expression in P+H and P+H+ was calculated with respect to PH+ and in P+H with respect to P+H+. The unique GO categories appearing in these comparisons are highlighted. The scale represents absolute number of DETs associated with each GO categories.
Figure 4
Figure 4
Differential expression of transcripts encoding heat shock factors (HSFs) and heat shock proteins (HSPs). (a) Heat map to show the global changes. In each case, the differential expression was calculated with respect to control plants (PH). The DETs were divided into different clades based on the general expression behaviour. (bm) The expression patterns of selected transcripts validated by qPCR. The values were normalized with respect to 18S and fold change in expression was plotted (n = 3; means ± SD).
Figure 5
Figure 5
Heat map to show the differential expression of miRs in P+H, P+H+ and PH+. In each case, the differential expression was calculated with respect to control non-primed plants (PH). These were divided into different clades as indicated.
Figure 6
Figure 6
Cytoscape interactome network to connect the GO terms (process) related to heat shock proteins, heat shock proteins (HSP) binding and heat stress (shown as rectangles) with transcripts (shown as circles) and their regulatory miRs (shown as triangles). The transcript and miR nodes are coloured to show the change in their expression. The basic image represents the interactions seen in P+H+ with respect to PH. The changes in PH+ with respect to PH are represented by the fill color of the larger circles and triangles overlapping the nodes. The changes in P+H with respect to PH are represented by the color of lines of the larger circles and triangles overlapping the nodes. Individual maps are shown as thumbnails on the right side.
Figure 7
Figure 7
(ag) The plot of relative fold change in expression of selected miRs and their targets as quantitated in plants under control conditions (PH), only thermo-primed conditions (P+H), thermo-priming followed by HTS (P+H+) and direct HTS (PH+). The expression values were obtained by qRT-PCR and normalized with respect to 18S. For plotting, the fold change was calculated with respect to values in PH. In each case (n = 3; means ± SD).

Similar articles

Cited by

References

    1. Hasanuzzaman M., Nahar K., Fujita M. Extreme temperature responses, oxidative stress and antioxidant defense in plants. In: Vahdati K., Leslie C., editors. Abiotic Stress Plant Responses Appllications in Agriculture. IntechOpen; London, UK: 2013. pp. 169–205.
    1. Teixeira E.I., Fischer G., Van Velthuizen H., Walter C., Ewert F. Global hot-spots of heat stress on agricultural crops due to climate change. Agric. For. Meteorol. 2013;170:206–215. doi: 10.1016/j.agrformet.2011.09.002. - DOI
    1. Liu Y., Li J., Zhu Y., Jones A., Rose R.J., Song Y. Heat stress in legume seed setting: Effects, causes, and future prospects. Front. Plant Sci. 2019;10:938. doi: 10.3389/fpls.2019.00938. - DOI - PMC - PubMed
    1. Wang D., Heckathorn S.A., Mainali K., Tripathee R. Timing effects of heat-stress on plant ecophysiological characteristics and growth. Front. Plant Sci. 2016;7:1629. doi: 10.3389/fpls.2016.01629. - DOI - PMC - PubMed
    1. Begcy K., Dresselhaus T. Epigenetic responses to abiotic stresses during reproductive development in cereals. Plant Reprod. 2018;31:343–355. doi: 10.1007/s00497-018-0343-4. - DOI - PMC - PubMed

LinkOut - more resources