. 2021 Mar 13;11(3):237.
doi: 10.3390/life11030237.

A Relationship between NTP and Cell Extract Concentration for Cell-Free Protein Expression

Affiliations

A Relationship between NTP and Cell Extract Concentration for Cell-Free Protein Expression

Katsuki Takahashi et al. Life (Basel). .

Abstract

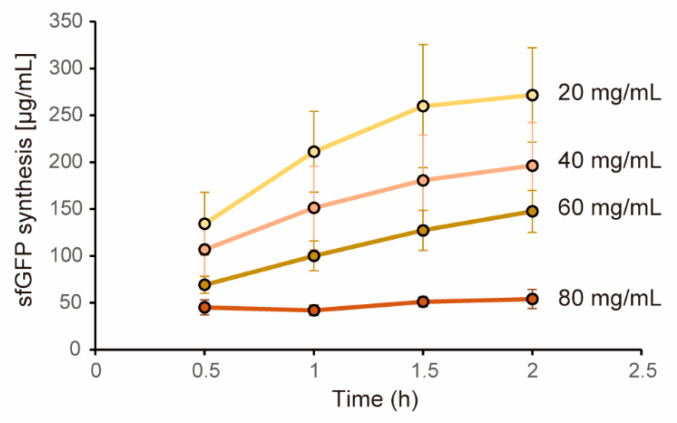
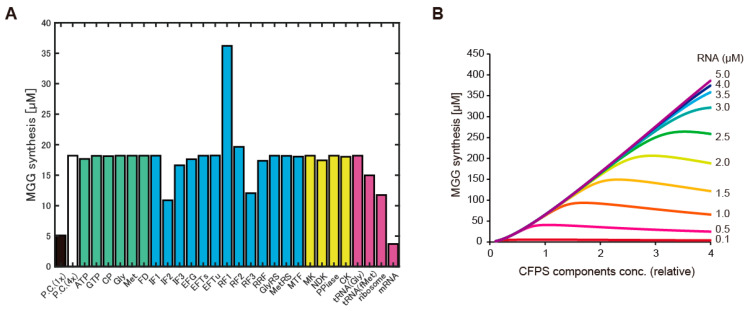
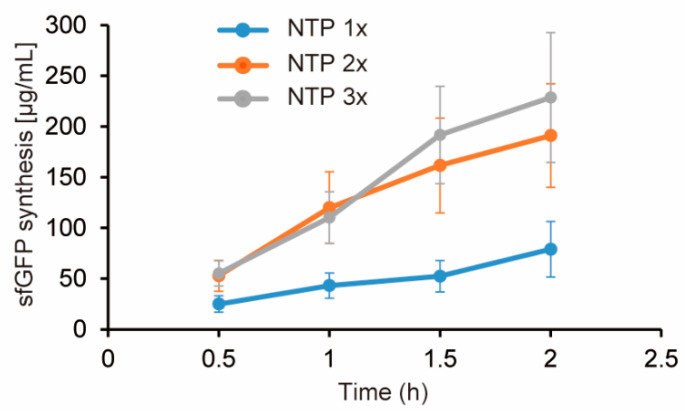
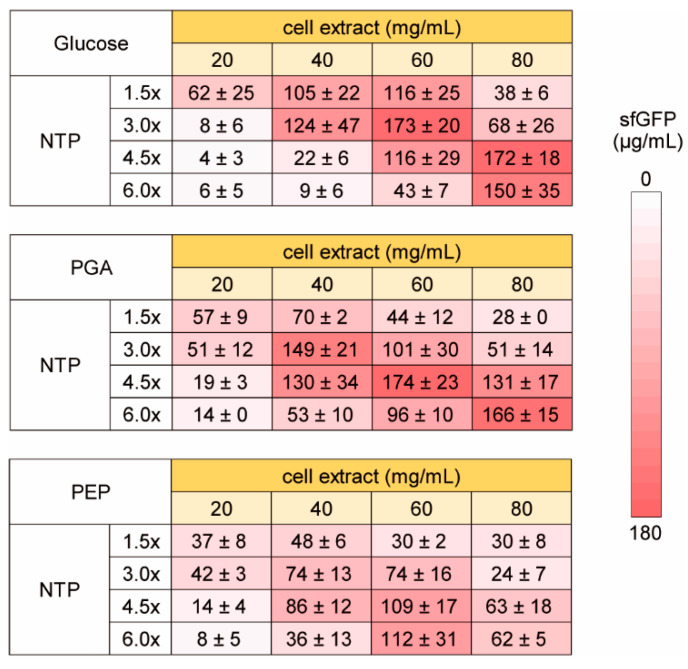
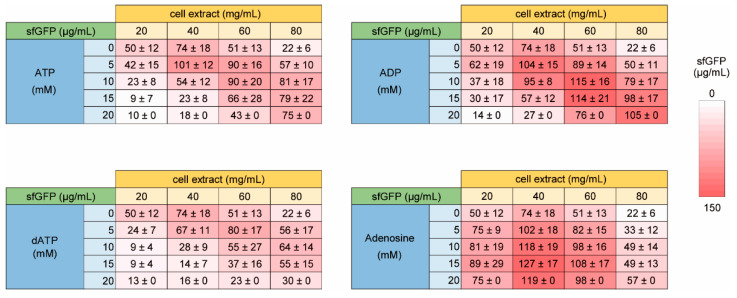
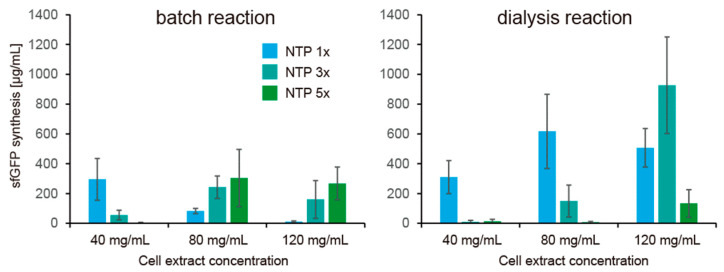
The cell-free protein synthesis (CFPS) that synthesizes mRNA and protein from a template DNA has been featured as an important tool to emulate living systems in vitro. However, an obstacle to emulate living cells by CFPS is the loss of activity in the case of usage of high concentration cell extracts. In this study, we found that a high concentration of NTP which inhibits in the case of lower concentration cell extract restored the loss of CFPS activity using high concentration cell extracts. The NTP restoration was independent of the energy regeneration system used, and NTP derivatives also restored the levels of CFPS using a high concentration cell extract. Experiments using dialysis mode of CFPS showed that continuous exchange of small molecule reduced levels of NTP requirement and improved reaction speed of CFPS using the high concentration of cell extract. These findings contribute to the development of a method to understand the condition of living cells by in vitro emulation, and are expected to lead to the achievement of the reconstitution of living cells from biomolecule mixtures.

Keywords: NTP requirement; cell extract; cell-free protein synthesis (CFPS); reconstitution of living cells; synthetic biology.


Conflict of interest statement

The authors declare no conflict of interest.

Figures

Figure 1
Figure 1
Dependence of CFPS levels on cell extract concentration. Expression levels of sfGFP were quantified periodically (0.5 h, 1 h, 1.5 h, 2 h) from fluorescence levels of sfGFP bands obtained by non-boiling SDS-PAGE. Concentration of sfGFP was determined from calibration curve obtained by purified sfGFP. CP-CK system was used as an energy regeneration system. Volumes of reaction mixtures are the same irrespective of the cell extract concentrations. Error bars indicate standard error of 3 times experiments performed in different days.
Figure 2
Figure 2
Analysis of shortage elements by using a biochemical simulator of CFPS. (A): Protein expression levels after 1000 s simulation using the PURE system simulator. P.C. (1×) indicates the developer condition of the PURE simulator. P.C. (4×) indicates concentration of all elements was 4 times higher than the developer condition. Others indicate the molecule that was omitted from the 4 times increase of the concentration. The y-axis indicates levels of peptide synthesis and MGG indicates the peptide Met-GlyGly which is the final product of the PURE system simulator. Colors of bars indicate group of the molecules (green: small molecules, blue: translation elements, yellow: other proteins, magenta: RNAs). (B): Relation among concentration of CFPS elements, protein synthesis levels after 1000 s simulation, and RNA concentration.
Figure 3
Figure 3
Increase of NTP concentration restores CFPS activity in high concentration cell extract. NTP 1× indicates normal NTP concentration described in Methods. NTP 2× and 3× indicate concentration of all NTP elements was doubled and tripled compared with the normal NTP concentration. Cell extract concentration used was 80 mg/mL. Error bars indicate standard error of 4 times experiments performed in different days.
Figure 4
Figure 4
Energy and NTP dependence of high concentration cell extract on CFPS activity. The levels of sfGFP synthesis (µg/mL) on averages and the standard errors of 3 times experiments performed on different days are shown. Raw data are shown in Supplementary Figure S2.
Figure 5
Figure 5
Effect of ATP and its derivative of high concentration cell extract on CFPS activity. The levels of sfGFP synthesis (µg/mL) on averages and the standard errors of 3 times experiments performed on different days are shown. Raw data are shown in Supplementary Figure S3.
Figure 6
Figure 6
NTP dependence of CFPS using highly concentrated cell extract under dialysis mode. NTP 1× indicates normal condition described in Methods, and NTP 3× and 5× indicate concentration of all NTP elements (ATP, GTP, CTP, UTP) are 3 times and 5 times higher than the normal concentration. Error bars indicate the standard errors of 3 times experiments performed on different days. Levels of sfGFP synthesis after 2 h reaction are shown. Raw data are shown in Supplementary Figure S4.

Similar articles

Cited by

References

    1. Katzen F., Chang G., Kudlicki W. The past, present and future of cell-free protein synthesis. Trends Biotechnol. 2005;23:150–156. doi: 10.1016/j.tibtech.2005.01.003. - DOI - PubMed
    1. Carlson E.D., Gan R., Hodgman C.E., Jewett M.C. Cell-free protein synthesis: Applications come of age. Biotechnol. Adv. 2012;30:1185–1194. doi: 10.1016/j.biotechadv.2011.09.016. - DOI - PMC - PubMed
    1. Silverman A.D., Karim A.S., Jewett M.C. Cell-free gene expression: An expanded repertoire of applications. Nat. Rev. Genet. 2020;21:151–170. doi: 10.1038/s41576-019-0186-3. - DOI - PubMed
    1. Jin X., Kightlinger W., Kwon Y.-C., Hong S.H. Rapid production and characterization of antimicrobial colicins using Escherichia coli-based cell-free protein synthesis. Synth. Biol. 2018;3 doi: 10.1093/synbio/ysy004. - DOI - PMC - PubMed
    1. Rolf J., Rosenthal K., Lütz S. Application of Cell-Free Protein Synthesis for Faster Biocatalyst Development. Catalysts. 2019;9:190. doi: 10.3390/catal9020190. - DOI

LinkOut - more resources