Comparative Study
. 2021 Mar 13;13(3):209.
doi: 10.3390/toxins13030209.

Saccharomyces cerevisiae Cell Wall-Based Adsorbent Reduces Aflatoxin B1 Absorption in Rats

Affiliations
Comparative Study

Saccharomyces cerevisiae Cell Wall-Based Adsorbent Reduces Aflatoxin B1 Absorption in Rats

Alexandros Yiannikouris et al. Toxins (Basel). .

Abstract

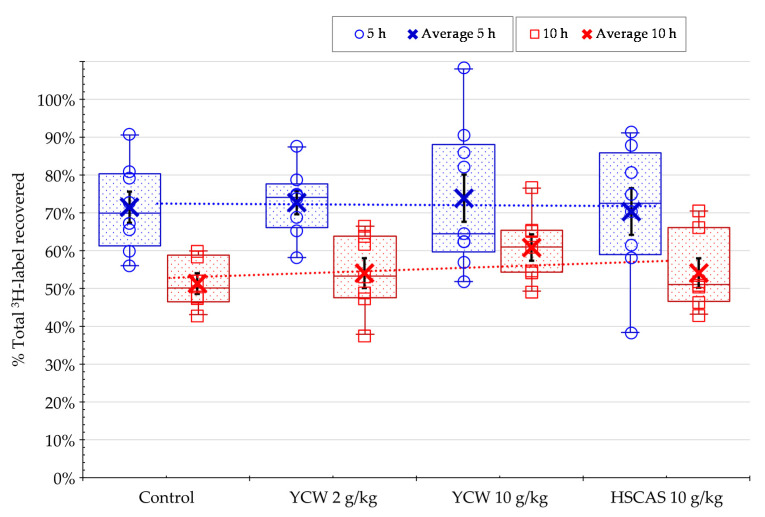
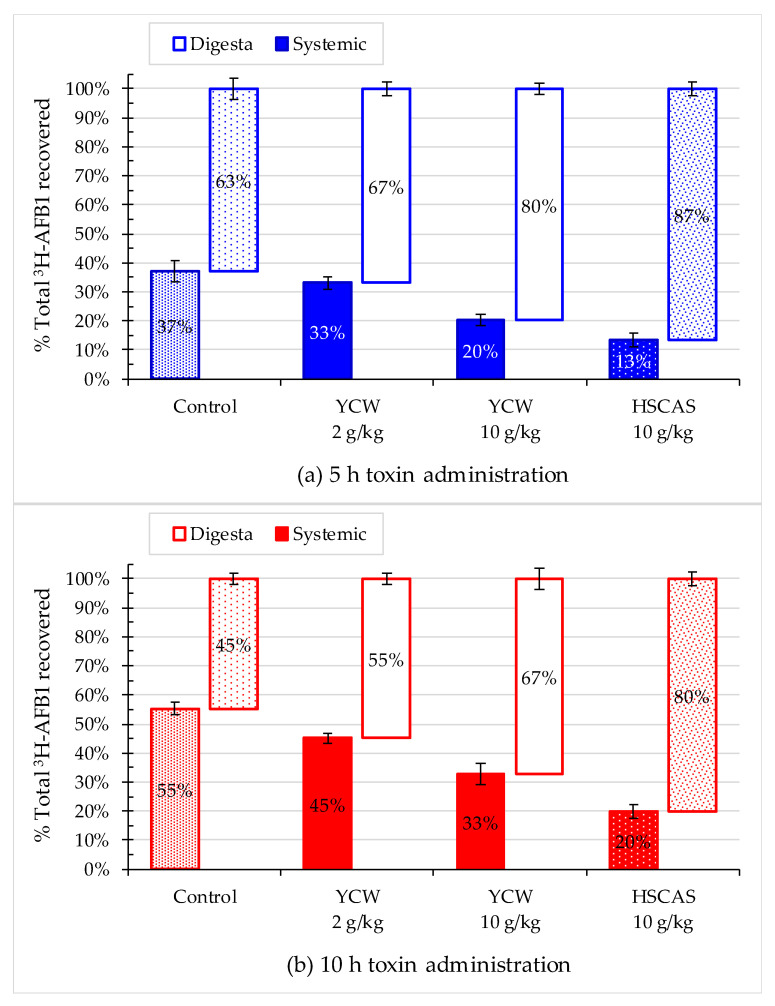
Mycotoxins are naturally occurring toxins that can affect livestock health and performance upon consumption of contaminated feedstuffs. To mitigate the negative effects of mycotoxins, sequestering agents, adsorbents, or binders can be included to feed to interact with toxins, aiding their passage through the gastrointestinal tract (GI) and reducing their bioavailability. The parietal cell wall components of Saccharomyces cerevisiae have been found to interact in vitro with mycotoxins, such as, but not limited to, aflatoxin B1 (AFB1), and to improve animal performance when added to contaminated diets in vivo. The present study aimed to examine the pharmacokinetics of the absorption of radiolabeled AFB1 in rats in the presence of a yeast cell wall-based adsorbent (YCW) compared with that in the presence of the clay-based binder hydrated sodium calcium aluminosilicate (HSCAS). The results of the initial pharmacokinetic analysis showed that the absorption process across the GI tract was relatively slow, occurring over a matter of hours rather than minutes. The inclusion of mycotoxin binders increased the recovery of radiolabeled AFB1 in the small intestine, cecum, and colon at 5 and 10 h, revealing that they prevented AFB1 absorption compared with a control diet. Additionally, the accumulation of radiolabeled AFB1 was more significant in the blood plasma, kidney, and liver of animals fed the control diet, again showing the ability of the binders to reduce the assimilation of AFB1 into the body. The results showed the potential of YCW in reducing the absorption of AFB1 in vivo, and in protecting against the damaging effects of AFB1 contamination.

Keywords: absorption; adsorption; aflatoxin B1; animal health; binder; mycotoxins; yeast cell wall.


Conflict of interest statement

The authors A.Y., G.P.D. and C.A.M. are employees of Alltech which produces and markets Mycosorb®, the commercial adsorbent evaluated in this study.

Figures

Figure 1
Figure 1
Concentrations of bound vs. free aflatoxin B1 (AFB1) evaluated at pH 3.0 using three independent batches of yeast cell wall-based adsorbent (YCW) or one hydrated sodium calcium aluminosilicate (HSCAS). (a) The concentration of free AFB1 at equilibrium is expressed as µg/mL, and the corresponding bound concentration of AFB1 is expressed as mg/g for each adsorbent used: YCW (open blue squares, circles, triangles) and HSCAS (red triangles) at pH 3.0; ((b) subfigure window) the concentration of the initially added AFB1 is expressed as µg/mL, and the corresponding bound concentration of AFB1 at equilibrium is expressed as mg/g for each adsorbent used: YCW (open blue squares, circles, triangles) and HSCAS (red triangles) at pH 3.0. All replicate values (three replicates per concentration tested for each individual product) are displayed in the graphic. Adsorption curves were fitted using the Freundlich equation.
Figure 2
Figure 2
Total recovery of the 3H-label from 3H-aflatoxin B1 (3H-AFB1) expressed as the percentage of the initial dose administered in all samples analyzed after the oral administration of AFB1-contaminated diet to rats in the presence or absence of yeast cell wall-based adsorbent (YCW) or hydrated sodium calcium aluminosilicate (HSCAS) at different concentrations. All replicate (open circles/squares) and average values (cross) are displayed in the graphic: (1) Box and whisker chart, as well as median (horizontal line), average (cross) and quartiles calculations (box); and (2) the regression curve of the average values shows the magnitude of the recovery. Bars (in black) in boxes correspond to the standard errors of the mean of the replicate rats. The study was performed initially on n = 64 rats, or 16 rats per treatment. At 5 h (in blue), n = 9 rats for the 10 g/kg YCW treatment and n = 8 for the rest of the treatments were collected for analysis; At 10 h (in red), the reminder rats (4 rats were excluded due to morbidity/mortality issues before the start of the main experimental study period) per treatments were collected for analysis, n = 6 in the control group and n = 7 in each of the adsorbent treated groups.
Figure 3
Figure 3
Distribution of the 3H-label from 3H-aflatoxin B1 (3H-AFB1) in rats at 5 (in blue) and 10 h (in red) after administration of the control treatment. Figures indicate the percentages of the total radiolabeled AFB1 recovered from digesta in different intestinal compartments and the total systemic radiolabeled AFB1 (the sum of radioactivity in the plasma, liver, and kidney). All replicate (open circles) and average values (cross) are displayed in the graphic: (1) Box and whisker chart, as well as median (horizontal line), average (cross), and quartiles calculations (box); and (2) the regression curve of the average values shows the magnitude of the recovery. Bars (in black) in boxes correspond to standard errors of the mean of the replicate rats. Control treatment initially comprised 16 rats. The integrality of each gastrointestinal compartiment was collected for: n = 8 rats at 5 h; the reminder n = 6 rats at 10 h (two rats were excluded from this analysis due to morbidity/mortality issues before the start of the main experimental study period) for analysis.
Figure 4
Figure 4
The effect of mycotoxin binders on the residual level of the 3H-label from 3H-aflatoxin B1 (3H-AFB1) in digesta at 5 (in blue) and 10 h (in red) after toxin administration with or without the addition of yeast cell wall-based adsorbent (YCW) at two concentrations or hydrated sodium calcium aluminosilicate (HSCAS). Panels (ae) show the percentage of recovered 3H-AFB1 found in the (a) stomach, (b) small intestine, (c) cecum, (d) colon, and (e) total digesta. Bars in the columns correspond to standard errors of the mean of the replicate rats. The significant difference between the control and amended feeds are indicated by asterisks as follows: * 0.01 ≤ p value < 0.05; ** 0.001 ≤ p value < 0.01; *** 0.001 ≤ p value < 0.001; **** p value < 0.0001 using Dunnett’s post-hoc test. In addition, pairwise comparisons were tested by Tukey’s post-hoc test. Different letters indicate significant difference between treatments within a sampling time point. Study was performed initially on n = 64 rats or 16 rats per treatment. At 5 h, n = 9 rats for the 10 g/kg YCW treatment and n = 8 for the rest of the treatments were collected for analysis; At 10 h, the reminder rats (four rats were excluded due to morbidity/mortality issues before the start of the main experimental study period) per treatments were collected for analysis, n = 6 in the control group and n = 7 in each of the adsorbent treated groups. Integrality of each digestive compartiment and systemic tissue was collected for each rat.
Figure 5
Figure 5
The effect of mycotoxin binders on the residual level of the 3H-label from 3H-aflatoxin B1 (3H-AFB1) in digesta at 5 (in blue) and 10 h (in red) after toxin administration with or without the addition of yeast cell wall-based adsorbent (YCW) at two concentrations or hydrated sodium calcium aluminosilicate (HSCAS). Panels (ad) show the percentage of recovered radioactivity found in the (a) plasma, (b) liver, (c) kidney, and (d) total systemic. Bars in columns correspond to standard errors of the mean of the replicate rats. Significant differences between the control and amended feeds are indicated by asterisks as follows: * 0.01 ≤ p < 0.05; ** 0.001 ≤ p <0.01; *** 0.001 ≤ p < 0.001; **** p < 0.0001 as analyzed using Dunnett’s post-hoc test. In addition, pairwise comparison was tested by Tukey’s post-hoc test; different letters indicate significant difference between treatments within a sampling time point. Study was performed on initially n = 64 rats or 16 rats per treatment. At 5 h, n = 9 rats for the 10 g/kg YCW treatment and n = 8 for the rest of the treatments were collected for analysis; At 10 h, the reminder rats (four rats were excluded due to morbidity/mortality issues before the start of the main experimental study period) per treatments were collected for analysis, n = 6 in the control group and n = 7 in each of the adsorbent treated groups. Integrality of each digestive compartiment and systemic tissue was collected for each rat.
Figure 6
Figure 6
Distribution of the recovered the 3H-label from 3H-aflatoxin B1 (3H-AFB1) in rat tissues (systemic) and intestinal content (digesta) at (a) 5 h (blue) and (b) 10 h (red) after the toxin administration with or without the addition of yeast cell wall-based adsorbent (YCW) at two concentrations or hydrated sodium calcium aluminosilicate (HSCAS). Error bars indicate standard errors of the mean. This study was performed initially on n = 64 rats, or 16 rats per treatment. At 5 h, n = 9 rats for the 10 g/kg YCW treatment and n = 8 for the rest of the treatments were collected for analysis; At 10 h, the reminder rats (four rats were excluded due to morbidity/mortality issues before the start of the main experimental study period) per treatments were collected for analysis, n = 6 in the control group and n = 7 in each of the adsorbent treated groups. Integrality of each digestive compartiment and systemic tissue was collected for each rat.
Figure 7
Figure 7
Dose response evaluation measured from the disintegration per minute of the 3H-label from 3H-aflatoxin B1 (3H-AFB1) normalized per gram of digesta or tissue collected (×1000 DPM/g) or per milliliter of plasma (×1000 DPM/mL) in rat at (a-1,a-2) 5 h (blue) and (b-1,b-2) 10 h (red) after the toxin administration with 0, 2, and 10 g/kg dose of yeast cell wall-based adsorbent (YCW). All data points measured are reported on: (1) Box and wiskers chart, as well as median (horizontal line), average (cross), and quartile calculations (box); and (2) the regression curve on the average values evaluating the direction and magnitude of the effect relative to the YCW dose. This study was performed initially on 16 rats per treatment. At 5 h, n = 9 rats for the 10 g/kg YCW treatment and n = 8 for the rest of the treatments were collected for analysis; at 10 h, the reminder rats (three rats were excluded from this analysis due to morbidity/mortality issues before the start of the main experimental study period) per treatments were collected for analysis, n = 6 in the control group and n = 7 in each of the YCW treated groups. Integrality of each digestive compartiment and systemic tissue was collected for each rat. All replicate (open circles/squares) and average values (cross) are displayed in the graphic.

Similar articles

Cited by

References

    1. Čolović R., Puvača N., Cheli F., Avantaggiato G., Greco D., Đuragić O., Kos J., Pinotti L. Decontamination of Mycotox-in-contaminated feedstuffs and compound feed. Toxins. 2019;11:617. doi: 10.3390/toxins11110617. - DOI - PMC - PubMed
    1. Yiannikouris A., Jouany J.-P. Mycotoxins in feeds and their fate in animals: A review. Anim. Res. 2002;51:81–99. doi: 10.1051/animres:2002012. - DOI
    1. Buckley T., Creighton A., Fogarty U. Analysis of Canadian and Irish forage, oats and commercially available equine con-centrate feed for pathogenic fungi and mycotoxins. Ir. Vet. J. 2007;60:231–236. doi: 10.1186/2046-0481-60-4-231. - DOI - PMC - PubMed
    1. CAST . Mycotoxins: Risks in Plant, Animal, and Human Systems. Council for Agricultural Science and Technology; Ames, IA, USA: 2003.
    1. Liu Y., Yamdeu J.H.G., Gong Y.Y., Orfila C. A review of postharvest approaches to reduce fungal and mycotoxin contam-ination of foods. Compr. Rev. Food Sci. Food Saf. 2020;19:1521–1560. doi: 10.1111/1541-4337.12562. - DOI - PubMed

Publication types

Substances

LinkOut - more resources