. 2021 Mar 13;22(6):2939.
doi: 10.3390/ijms22062939.

Intracerebral Administration of a Ligand-ASO Conjugate Selectively Reduces α-Synuclein Accumulation in Monoamine Neurons of Double Mutant Human A30P*A53T*α-Synuclein Transgenic Mice

Affiliations

Intracerebral Administration of a Ligand-ASO Conjugate Selectively Reduces α-Synuclein Accumulation in Monoamine Neurons of Double Mutant Human A30P*A53T*α-Synuclein Transgenic Mice

Rubén Pavia-Collado et al. Int J Mol Sci. .

Abstract

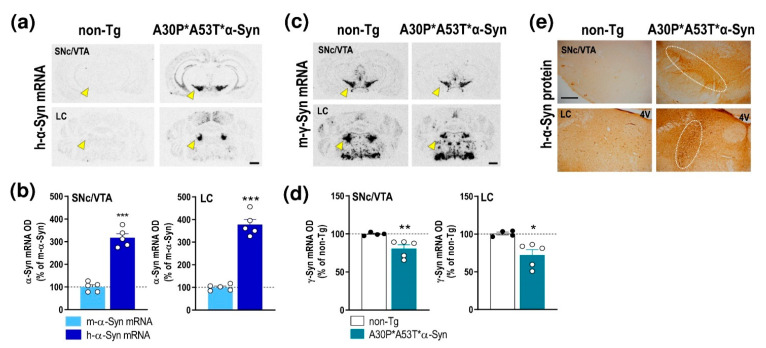
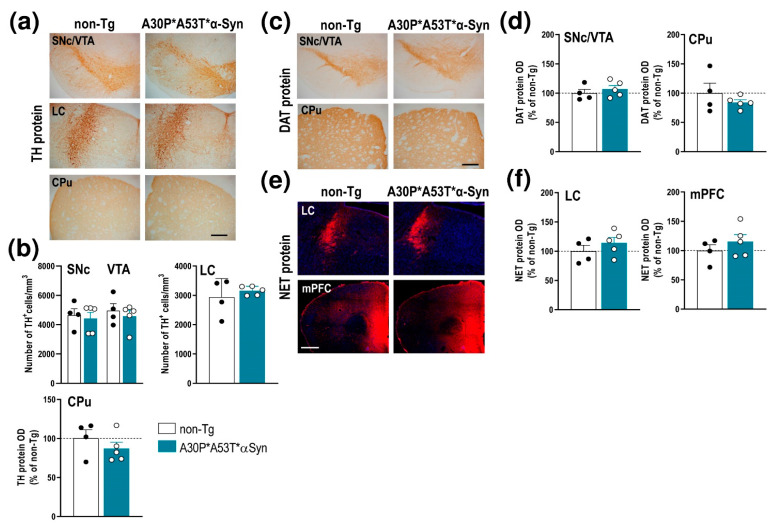
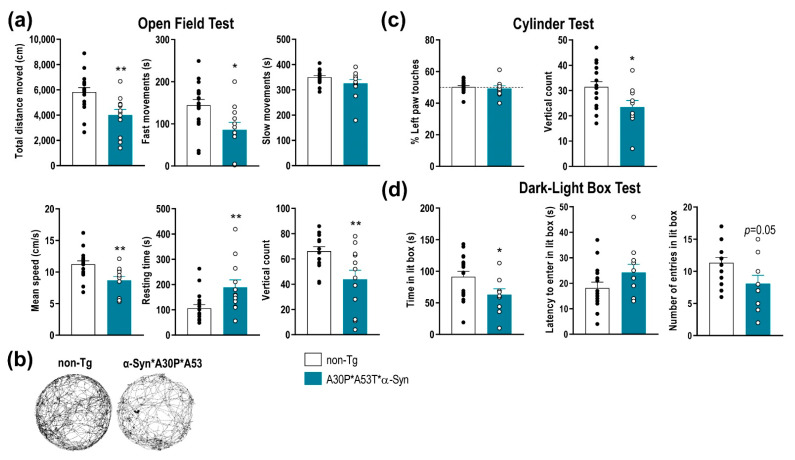
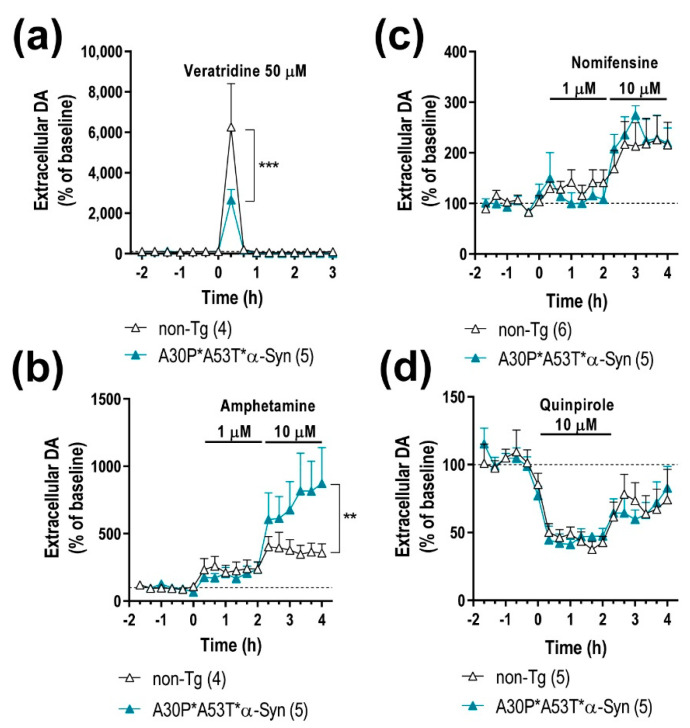
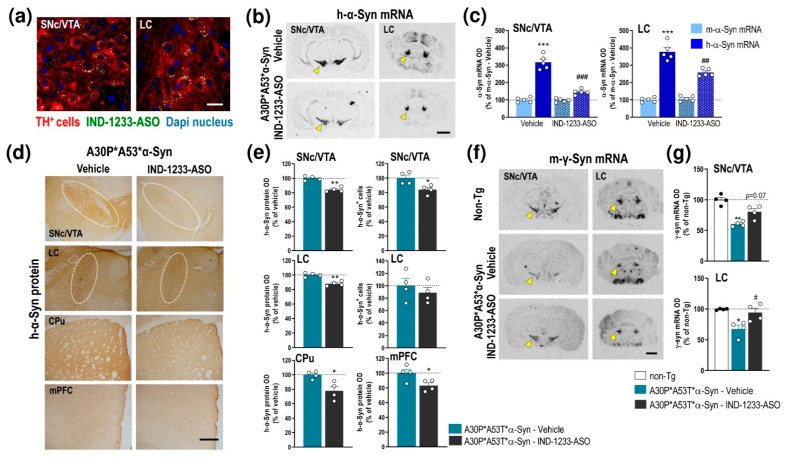
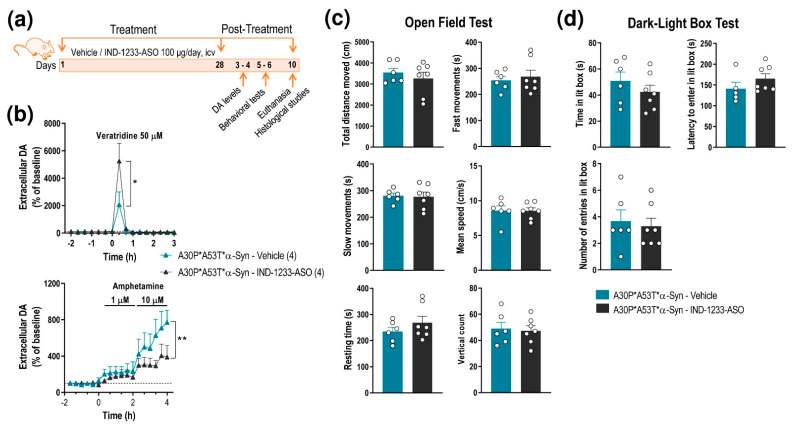
α-Synuclein (α-Syn) protein is involved in the pathogenesis of Parkinson's disease (PD). Point mutations and multiplications of the α-Syn, which encodes the SNCA gene, are correlated with early-onset PD, therefore the reduction in a-Syn synthesis could be a potential therapy for PD if delivered to the key affected neurons. Several experimental strategies for PD have been developed in recent years using oligonucleotide therapeutics. However, some of them have failed or even caused neuronal toxicity. One limiting step in the success of oligonucleotide-based therapeutics is their delivery to the brain compartment, and once there, to selected neuronal populations. Previously, we developed an indatraline-conjugated antisense oligonucleotide (IND-1233-ASO), that selectively reduces α-Syn synthesis in midbrain monoamine neurons of mice, and nonhuman primates. Here, we extended these observations using a transgenic male mouse strain carrying both A30P and A53T mutant human α-Syn (A30P*A53T*α-Syn). We found that A30P*A53T*α-Syn mice at 4-5 months of age showed 3.5-fold increases in human α-Syn expression in dopamine (DA) and norepinephrine (NE) neurons of the substantia nigra pars compacta (SNc) and locus coeruleus (LC), respectively, compared with mouse α-Syn levels. In parallel, transgenic mice exhibited altered nigrostriatal DA neurotransmission, motor alterations, and an anxiety-like phenotype. Intracerebroventricular IND-1233-ASO administration (100 µg/day, 28 days) prevented the α-Syn synthesis and accumulation in the SNc and LC, and recovered DA neurotransmission, although it did not reverse the behavioral phenotype. Therefore, the present therapeutic strategy based on a conjugated ASO could be used for the selective inhibition of α-Syn expression in PD-vulnerable monoamine neurons, showing the benefit of the optimization of ASO molecules as a disease modifying therapy for PD and related α-synucleinopathies.

Keywords: Parkinson’s disease; antisense oligonucleotide; dopamine neurotransmission; double mutant A30P*A53T*; motor deficits; transgenic mouse model; α-synuclein.


Conflict of interest statement

R. Revilla, A. Montefeltro, F. Artigas, and A. Bortolozzi are the authors of the patent WO/2011/131693 issued for the siRNA and ASO molecules and the targeting approach related to this work. R. Revilla is board members of nLife Therapeutics S.L. A. Montefeltro is a stockholder of nLife Therapeutics S.L. The rest of the authors declare no competing interests.

Figures

Figure 1
Figure 1
Profile of α-Syn expression in monoamine brain areas of A30P*A53T*α-Syn transgenic mice. (a) Coronal brain sections showing h-α-Syn mRNA levels in SNc/VTA assessed by in situ hybridization. Yellow arrowheads indicate the brain regions quantified in b. Scale bar: 1 mm. (b) Increased h-α-Syn mRNA expression in SNc/VTA and LC of A30P*A53T*α-Syn transgenic mice compared with m-α-Syn mRNA expression levels in the same mice (n = 5 mice/group; *** p < 0.001 vs. m-α-Syn mRNA levels; Student’s t-test). (c) Coronal brain sections showing m-γ-Syn mRNA levels in SNc/VTA and LC assessed by in situ hybridization. Yellow arrowheads show the lower density of m-γ-Syn expression in A30P*A53T*α-Syn mice compared with non-Tg mice. Scale bar: 1 mm. (d) Reduced m-γ-Syn mRNA expression in SNc/VTA and LC of A30P*A53T*α-Syn transgenic mice compared with non-Tg mice (n = 4–5 mice/group; * p < 0.05, ** p < 0.01 versus non-Tg mice; Student’s t-test). (e) Representative photomicrographs showing accumulated levels of h-α-Syn protein in SNc/VTA and LC of A30P*A53T*α-Syn transgenic mice. White frames indicate the SNc/VTA and LC brain regions. Scale bar: 200 µm. For all figures, data represent the mean ± SEM. Abbreviations: SNc, substantia nigra compacta; VTA, ventral tegmental area; LC, locus coeruleus; 4V, 4-ventricle. See also Supplemental Figure S1.
Figure 2
Figure 2
Integrity of DA and NE systems of middle-aged (5 months) A30P*A53T*α-Syn transgenic mice. (a) TH-immunostained brain sections containing SNc/VTA, LC and CPu. Scale bar: 200 µm. (b) No differences in the number of TH+ neurons were found in the SNc, VTA or LC of A30P*A53T*α-Syn vs. non-Tg mice. Likewise, the density of striatal TH+ terminals was comparable between both phenotypes. (c) DAT-immunostained brain sections containing SNc/VTA and CPu. Scale bar: 200 µm. (d) No differences in DAT protein density were found in the SNc, VTA or CPu of A30P*A53T*α-Syn vs. non-Tg mice. (e) Confocal images showing the NET protein density in LC and mPFC of A30P*A53T*α-Syn and non-Tg mice. Scale bar: 200 µm. (f) No differences in NET protein density were found in LC and mPFC of both phenotypes. Data are represented as mean ± SEM, n = 4–5 mice/group. Abbreviations: mPFC, medial prefrontal cortex; CPu, caudate putamen; HPC, hippocampus; SNc, substantia nigra compacta; VTA, ventral tegmental area; DR, dorsal raphe nucleus; LC, locus coeruleus.
Figure 3
Figure 3
Impairment of motor function and anxiety-like behaviors in A30P*A53T*α-Syn transgenic mice. (a) Comparison of spontaneous locomotor activity between 5-month-old A30P*A53T*α-Syn and non-Tg mice in the open field test. Total distance traveled, fast movements, average speed and vertical count were significantly decreased in A30P*A53T*α-Syn mice compared with non-Tg mice. In parallel, transgenic mice showed an increased resting time compared with non-Tg mice. (b) Representative locomotor activity tracking was obtained from both phenotypes. (c) No difference in motor asymmetry examined by the use of the left paw was detected. However, A30P*A53T*α-Syn mice showed a reduced vertical count in the cylinder test compared with non-Tg mice. (d) In the dark-light box test, A30P*A53T*α-Syn transgenic mice evoked an anxiety-like response compared with non-Tg mice, as shown by the shorter spent time in the lit box but the marginal effects in the latency period to entering in the light box or the number of entries. Data are the mean ± SEM, n = 10–15 mice/group. Student’s t-test, * p < 0.05, ** p < 0.01 compared with non-Tg mice. See also Supplemental Figure S2.
Figure 4
Figure 4
A30P*A53T*α-Syn overexpression in TH+ neurons alters DA neurotransmission in the nigrostriatal pathway. (a) Local veratridine infusion (depolarizing agent; 50 μM) significantly increased DA release in the caudate putamen (CPu) of both mouse phenotypes. However, this effect was significant smaller in A30P*A53T*α-Syn mice than in non-Tg mice. (b) Direct application of amphetamine (DA releaser and DAT inhibitor; 1 and 10 μM) by reverse dialysis induced increases in DA release in the CPu, with the effect being significantly more pronounced in A30P*A53T*α-Syn mice than in non-Tg mice. (c) However, local nomifensine infusion (DAT inhibitor; 1 and 10 μM) dose-dependently increased the extracellular DA concentration in CPu, with this effect comparable being in both phenotypes. (d) Local activation of DA D2 receptors with quinpirole (DA D2 agonist, 10 μM) similarly decreased striatal DA release in A30P*A53T*α-Syn and non-Tg mice. Data are expressed as the mean ± SEM, n = 4–6 mice/group as indicated in the parenthesis. Two-way ANOVA and Tukey’s multiple comparisons test, ** p < 0.01, *** p < 0.001 compared with non-Tg mice.
Figure 5
Figure 5
Intracerebroventricular IND-1233-ASO treatment selectively inhibits the expression and accumulation of h-α-Syn in interconnected DA and NE brain regions of A30P*A53T*α-Syn transgenic mice. (a) Confocal images showing the co-localization of A488-IND-1233-ASO (green) with TH+ neurons (red) in the SNc/VTA and LC. Cell nuclei were stained with DAPI (blue). Scale bar: 10 µm. (b) Coronal brain sections showing reduced h-α-Syn mRNA expression in the SNc/VTA and LC of A30P*A53T*α-Syn mice treated with IND-1233-ASO (100 µg/day for 28 days), as assessed by in situ hybridization. Yellow arrowheads show h-α-Syn mRNA expression in SNc/VTA and LC. Scale bar: 1 mm. (c) Bar graphs showing significant reductions in h-α-Syn mRNA levels, but not m-α-Syn mRNA, in SNc/VTA and LC of IND-1233-ASO-treated A30P*A53T*α-Syn mice (n = 5 mice/group; *** p < 0.001 vs. m-α-Syn mRNA levels; ## p < 0.01, ### p < 0.001 vs. vehicle-treated A30P*A53T*α-Syn mice; two-way ANOVA and Tukey’s multiple comparisons test). (d) Representative photomicrographs showing a lower h-α-Syn protein density in the SNc/VTA, LC, CPu and mPFC of IND-1233-ASO-treated A30P*A53T*α-Syn mice vs. vehicle-treated A30P*A53T*α-Syn mice. White frames indicate SNc/VTA and LC brain regions. Scale bar: 200 µm. (e) Bar graphs showing significant reductions in h-α-Syn protein levels in the brain areas analyzed, as well as a decreased number of h-α-Syn+ cells in the SNc/VTA of IND-1233-ASO-treated A30P*A53T*α-Syn mice (n = 4 mice/group; * p < 0.05, ** p < 0.01 versus vehicle-treated A30P*A53T*α-Syn mice; Student’s t-test). (f) Representative images showing increased m-γ-Syn mRNA expression in SNc/VTA and LC of A30P*A53T*α-Syn mice treated with IND-1233-ASO as assessed by in situ hybridization. Yellow arrowheads show m-γ-Syn mRNA expression in SNc/VTA and LC. Scale bar: 1 mm. (g) Bar graphs showing significant increases in m-γ-Syn expression in the LC and a marginal effect in the SNc/VTA of IND-1233-ASO-treated A30P*A53T*α-Syn mice (n = 4 mice/group; * p < 0.05, ** p < 0.01 vs. non-Tg mice; # p < 0.05 vs. vehicle-treated A30P*A53T*α-Syn mice; one-way ANOVA). For all figures, data are the mean ± SEM. Abbreviations: mPFC, medial prefrontal cortex; CPu, caudate putamen; SNc, substantia nigra compacta; VTA, ventral tegmental area; LC, locus coeruleus. See also Supplemental Figure S3.
Figure 6
Figure 6
Intracerebroventricular IND-1233-ASO treatment recovers DA neurotransmission deficits, but not behavioral phenotype, in A30P*A53T*α-Syn transgenic mice. (a) Treatment timeline. A30P*A53T*α-Syn transgenic mice (4 months of age) received randomly vehicle or IND-1233-ASO (100 µg/day) into the lateral ventricle for 28 days using osmotic minipumps. In a group of mice, DA release was examined using intracerebral microdialysis at 3–4 days post-treatment, while behavioral tests were performed in an additional group at 5–6 days post-treatment. All mice were sacrificed on day 10 post-treatment. (b) Microdialysis approach using veratridine and amphetamine agents, as shown in Figure 3, confirmed the normalization of DA neurotransmission in the CPu of A30P*A53T*α-Syn mice treated with IND-1337-ASO (100 μg/day for 28 days) compared with transgenic mice treated with a vehicle. (c,d) No significant differences were detected in the open field test (c) or the dark-light box test (d) between both groups treated with IND-1337-ASO or a vehicle. Data are expressed as the mean ± SEM. Number of mice used in each procedure is indicated in parenthesis. Two-way ANOVA and Tukey’s multiple comparisons test, * p < 0.05, ** p < 0.01 compared to A30P*A53T*α-Syn mice treated with a vehicle.

References

    1. Braak H., Del Tredici K., Bohl J., Bratzke H., Braak E. Pathological changes in the parahippocampal region in select non-Alzheimer’s dementias. Ann. N. Y. Acad. Sci. 2000;911:221–239. doi: 10.1111/j.1749-6632.2000.tb06729.x. - DOI - PubMed
    1. Reeve A., Simcox E., Turnbull D. Ageing and Parkinson’s disease: Why is advancing age the biggest risk factor? Ageing Res. Rev. 2014;14:19–30. doi: 10.1016/j.arr.2014.01.004. - DOI - PMC - PubMed
    1. Braak H., Gai W.P., Del Tredici K. Idiopathic Parkinson’s disease: Possible routes by which vulnerable neuronal types may be subject to neuroinvasion by an unknown pathogen. J. Neural Transm. 2003;110:517–536. doi: 10.1007/s00702-002-0808-2. - DOI - PubMed
    1. Li J.Y., Englund E., Holton J.L., Soulet D., Hagell P., Lees A.J., Lashley T., Quinn N.P., Rehncrona S., Björklund A., et al. Lewy bodies in grafted neurons in subjects with Parkinson’s disease suggest host-to-graft disease propagation. Nat. Med. 2008;14:501–503. doi: 10.1038/nm1746. - DOI - PubMed
    1. Desplats P., Lee H.J., Bae E.-J., Patrick C., Rockenstein E., Crews L., Spencer B., Masliah E., Lee S.-J. Inclusion formation and neuronal cell death through neuron-to-neuron transmission of -synuclein. Proc. Natl. Acad. Sci. USA. 2009;106:13010–13015. doi: 10.1073/pnas.0903691106. - DOI - PMC - PubMed

MeSH terms