A Phenome-Wide Association Study (PheWAS) of COVID-19 Outcomes by Race Using the Electronic Health Records Data in Michigan Medicine
- PMID: 33805886
- PMCID: PMC8037108
- DOI: 10.3390/jcm10071351
A Phenome-Wide Association Study (PheWAS) of COVID-19 Outcomes by Race Using the Electronic Health Records Data in Michigan Medicine
Abstract
Background: We performed a phenome-wide association study to identify pre-existing conditions related to Coronavirus disease 2019 (COVID-19) prognosis across the medical phenome and how they vary by race.
Methods: The study is comprised of 53,853 patients who were tested/diagnosed for COVID-19 between 10 March and 2 September 2020 at a large academic medical center.
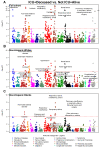
Results: Pre-existing conditions strongly associated with hospitalization were renal failure, pulmonary heart disease, and respiratory failure. Hematopoietic conditions were associated with intensive care unit (ICU) admission/mortality and mental disorders were associated with mortality in non-Hispanic Whites. Circulatory system and genitourinary conditions were associated with ICU admission/mortality in non-Hispanic Blacks.
Conclusions: Understanding pre-existing clinical diagnoses related to COVID-19 outcomes informs the need for targeted screening to support specific vulnerable populations to improve disease prevention and healthcare delivery.
Keywords: EHR; biobank; health disparities; odds ratio; phenome; risk profile.
Conflict of interest statement
The authors have no conflict of interests to declare.
Figures


Update of
-
A phenome-wide association study (PheWAS) of COVID-19 outcomes by race using the electronic health records data in Michigan Medicine.medRxiv [Preprint]. 2021 Feb 20:2020.06.29.20141564. doi: 10.1101/2020.06.29.20141564. medRxiv. 2021. Update in: J Clin Med. 2021 Mar 25;10(7):1351. doi: 10.3390/jcm10071351. PMID: 32793923 Free PMC article. Updated. Preprint.
References
-
- Denny J.C., Ritchie M.D., Basford M.A., Pulley J.M., Bastarache L., Brown-Gentry K., Wang D., Masys D.R., Roden D.M., Crawford D.C. PheWAS: Demonstrating the feasibility of a phenome-wide scan to discover gene-disease associations. Bioinformatics. 2010;26:1205–1210. doi: 10.1093/bioinformatics/btq126. - DOI - PMC - PubMed
-
- Verma A., Lucas A., Verma S.S., Zhang Y., Josyula N., Khan A., Hartzel D.N., Lavage D.R., Leader J., Ritchie M.D., et al. PheWAS and Beyond: The Landscape of Associations with Medical Diagnoses and Clinical Measures across 38,662 Individuals from Geisinger. Am. J. Hum. Genet. 2018;102:592–608. doi: 10.1016/j.ajhg.2018.02.017. - DOI - PMC - PubMed
-
- Zhao X., Geng X., Srinivasasainagendra V., Chaudhary N., Judd S., Wadley V., Gutiérrez O.M., Wang H., Lange E.M., Lange L.A., et al. A PheWAS study of a large observational epidemiological cohort of African Americans from the REGARDS study. BMC Med Genom. 2019;12:167–177. doi: 10.1186/s12920-018-0462-7. - DOI - PMC - PubMed
-
- Cai T., Zhang Y., Ho Y.-L., Link N., Sun J., Huang J., Cai T.A., Damrauer S., Ahuja Y., Honerlaw J., et al. Association of Interleukin 6 Receptor Variant With Cardiovascular Disease Effects of Interleukin 6 Receptor Blocking Therapy. JAMA Cardiol. 2018;3:849–857. doi: 10.1001/jamacardio.2018.2287. - DOI - PMC - PubMed
Grants and funding
LinkOut - more resources
Full Text Sources
Other Literature Sources
Medical

