. 2021 Mar 25;22(7):3378.
doi: 10.3390/ijms22073378.

Quantitative Proteomic Approach Reveals Altered Metabolic Pathways in Response to the Inhibition of Lysine Deacetylases in A549 Cells under Normoxia and Hypoxia

Affiliations

Quantitative Proteomic Approach Reveals Altered Metabolic Pathways in Response to the Inhibition of Lysine Deacetylases in A549 Cells under Normoxia and Hypoxia

Alfonso Martín-Bernabé et al. Int J Mol Sci. .

Abstract

Growing evidence is showing that acetylation plays an essential role in cancer, but studies on the impact of KDAC inhibition (KDACi) on the metabolic profile are still in their infancy. Here, we analyzed, by using an iTRAQ-based quantitative proteomics approach, the changes in the proteome of KRAS-mutated non-small cell lung cancer (NSCLC) A549 cells in response to trichostatin-A (TSA) and nicotinamide (NAM) under normoxia and hypoxia. Part of this response was further validated by molecular and biochemical analyses and correlated with the proliferation rates, apoptotic cell death, and activation of ROS scavenging mechanisms in opposition to the ROS production. Despite the differences among the KDAC inhibitors, up-regulation of glycolysis, TCA cycle, oxidative phosphorylation and fatty acid synthesis emerged as a common metabolic response underlying KDACi. We also observed that some of the KDACi effects at metabolic levels are enhanced under hypoxia. Furthermore, we used a drug repositioning machine learning approach to list candidate metabolic therapeutic agents for KRAS mutated NSCLC. Together, these results allow us to better understand the metabolic regulations underlying KDACi in NSCLC, taking into account the microenvironment of tumors related to hypoxia, and bring new insights for the future rational design of new therapies.

Keywords: NSCLC; cancer metabolism; hypoxia; lysine deacetylase inhibitors.


Conflict of interest statement

The authors declare no conflict of interest.

Figures

Figure 1
Figure 1
(A) Effect of trichostatin-A (TSA) and nicotinamide (NAM) treatments on A549 cell proliferation. A549 cells treated with 1 μM TSA, 20 mM NAM, or both 1 μM TSA and 20 mM NAM for 24 h and 48 h of incubation under normoxia or hypoxia. Dots represent means ± standard deviations of three independent experiments. (B) Apoptosis analysis of KDACI-treated A549 cells under normoxia and hypoxia. Apoptosis was measured after 24 h of incubation. Cells in the stage of early apoptosis are represented as the percentage with respect to total cells. A549 cells were treated with 1 μM TSA, 20 mM NAM or both 1 μM TSA and 20 mM NAM for 24 h under normoxia or hypoxia. Bars represent the means ± standard error of the mean of three independent experiments. The asterisks above bars indicate statistically significant differences compared to normoxic control cells. Asterisks above curly brackets indicate statistically significant differences between hypoxic and normoxic treatments and between hypoxic treatments and hypoxic control cells. Statistical significance was assessed by a two-tailed Student’s t-test. ** p ≤ 0.01; *** p ≤ 0.001.
Figure 2
Figure 2
Extracellular metabolite quantitation of KDACI-treated A549 cells under normoxia and hypoxia. The glucose uptake (A), lactate production (B), and glutamine uptake (C) were measured in the beginning and at the end of the 24 h-incubation, and the metabolite consumption/production rates were normalized by the number of cells in each condition. (AC) A549 cells were treated with 1 μM TSA, 20 mM NAM, or both 1 μM TSA and 20 mM NAM for 24 h under normoxia or hypoxia. Bars represent the means ± standard error of the mean of three independent experiments. The asterisks above bars indicate statistically significant differences compared to normoxic control cells. The asterisks above curly brackets indicate statistically significant differences between hypoxic and normoxic treatments and between hypoxic treatments and hypoxic control cells. Statistical significance was assessed by a two-tailed Student’s t-test. * p ≤ 0.05; ** p ≤ 0.01; *** p ≤ 0.001.
Figure 3
Figure 3
Effect of KDAC inhibition on the global proteome and metabolic enzymes compared to control A549 cells. Quantitative proteomic analysis of differentially expressed proteins in A549 cells treated with 1 μM of TSA, 20 mM of NAM or both 1 μM TSA, and 20 mM NAM for 24 h under normoxic conditions. (A) The number of up-regulated and down-regulated proteins (isobaric Tags for Relative and Absolute Quantitation (iTRAQ) ratio > 1 and <1, respectively) showing significant (p-value ≤ 0.05) differences between TSA, NAM and TSA/NAM treatments with respect to control cells. (B) GO enrichment analysis of the Biological process term for each condition shown as the percentage of proteins related to each process. All biological processes are shown as significantly (p-value ≤ 0.05) up-regulated or down-regulated. (C) Quantitative measurement of the main metabolic enzymes identified using the iTRAQ approach for the different conditions compared to untreated control cells. Significantly up-regulated enzymes (iTRAQ ratio > 1 and p-value ≤ 0.05) are represented in green and significantly down-regulated enzymes (iTRAQ ratio < 1 and p-value ≤ 0.05) are represented in red. Non-significantly up-regulated, and down-regulated enzymes are represented in gray.
Figure 4
Figure 4
Effect of KDAC inhibition on enzyme activities in A549 cells under normoxia and hypoxia. (A,B) The ATP- dependent 6-phosphofructokinase (PFK1) (A) and lactate dehydrogenase (LDH) (B) enzymatic activities were measured after 24 h of incubation, and activities were normalized to intracellular protein content in each condition. A549 cells were treated with 1 μM of TSA, 20 mM of NAM, and both 1 μM TSA and 20 mM NAM for 24 h of incubation under normoxia and hypoxia. Cells incubated in medium without KDACIs served as control. Bars represent the means ± standard error of the mean of three independent experiments. The asterisks above bars indicate statistically significant differences compared to normoxic control cells. The asterisks above curly brackets indicate statistically significant differences between hypoxic and normoxic treatments and between hypoxic treatments and hypoxic control cells. Statistical significance was assessed by a two-tailed Student’s t-test. *, p ≤ 0.05; **, p ≤ 0.01; ***, p ≤ 0.001. (C) Western blot images of HIF-1α and selected metabolic enzymes identified by iTRAQ. A549 cells were treated with 1 μM of TSA, 20 mM of NAM and both 1 μM TSA and 20 mM NAM for 24 h of incubation under normoxia and hypoxia. Cells incubated in medium without KDACIs served as control. Immunoblotting of hypoxia-inducible factor-1α (HIF-1α), glucose-6-phosphate isomerase (GPI), phosphofructokinase-1 (PFK1), fructose-bisphosphate aldolase C (ALDC), glyceraldehyde-3-phosphate dehydrogenase (GAPDH), alpha-enolase (ENO1), lactate dehydrogenase A (LDH-A), lactate dehydrogenase B (LDH-B) and 2-oxoglutarate dehydrogenase (OGDH). β-actin was used as the loading control. (D) Densitometry analysis of selected metabolic enzymes shown in C. The ratios of the Western blot bands (WB ratios) of KDACI-treated cells to control cells under normoxia after normalization to β-actin. Densitometric values are presented as mean ± standard deviation. Asterisks indicate significant differences compared to untreated normoxic control cells assessed by two-tailed Student’s t-test in WB ratios and R software package Isobar (iTRAQ ratios) * p ≤ 0.05; ** p ≤ 0.01; *** p ≤ 0.001.
Figure 5
Figure 5
Effect of KDAC inhibition and hypoxia on the global proteome and metabolic enzymes compared to control A549 cells under normoxia. Quantitative proteomic analysis of differentially expressed proteins in A549 cells treated with 1 μM of TSA, 20 mM of NAM, and both 1 μM TSA and 20 mM NAM for 24 h under hypoxic conditions. (A) The number of up-regulated and down-regulated proteins (iTRAQ ratio > 1 and <1, respectively) showing significant (p-value ≤ 0.05) differences between TSA, NAM, and TSA/NAM treatments under hypoxia with respect to control cells under normoxia. (B) GO enrichment analysis of the Biological process term for each condition shown as the percentage of proteins related to each process. All biological processes are shown as significantly (p-value ≤ 0.05) up-regulated or down-regulated. (C) Quantitative measurement of the main metabolic enzymes identified using the iTRAQ approach for the different conditions compared to untreated control cells under normoxia. Significantly up-regulated enzymes (iTRAQ ratio > 1 and p-value ≤ 0.05) are represented in green and significantly down-regulated enzymes (iTRAQ ratio < 1 and p-value ≤ 0.05) are represented in red. Non-significantly up-regulated and down-regulated enzymes are represented in gray.
Figure 6
Figure 6
Classification of drugs targeting metabolic protein networks modulated by TSA and NAM in hypoxia conditions. The classification of chemicals is done through a deep machine learning according to their link to bronco-alveolar adenocarcinoma and cell metabolism processes (ATP metabolic process (GO:0046034), oxidation–reduction process (GO:0055114), carbohydrate metabolic process (GO:0005975), lipid metabolic process (GO:0006629), and cellular protein metabolic process (GO:0044267)). Five hundred chemicals were classified. A high score symbolized a high link of the chemical with the cell metabolism process and our protein network. The classification presented here was obtained by extracting drugs obtained by our machine learning analysis in the top 70 rank of chemicals related to MESH: D002282 pulmonary adenocarcinoma with exclusion of chemicals/metabolites. The top 70 rank ensures a high link between the chemical and data reported on these chemicals in the literature in broncho-alveolar adenocarcinoma (MESH: D002282 pulmonary adenocarcinoma).
Figure 7
Figure 7
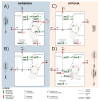
Schematic representation of the dysregulation of metabolic enzymes triggered by TSA and NAM under normoxia and hypoxia in A549 cells. Metabolic pathways are represented with dysregulated enzymes quantified by iTRAQ. Significantly up-regulated enzymes (iTRAQ ratio > 1 and p-value ≤ 0.05) are represented by green arrows. Significantly down-regulated enzymes (iTRAQ ratio < 1 and a p-value ≤ 0.05) are represented by red arrows. Non-significantly dysregulated enzymes are represented by grey arrows. Metabolic dysregulations confirmed by enzyme activities and Western blot analyses are represented by check box and check marks, respectively. Downward and upward white arrows indicate significant changes in metabolite consumption and production rates. (A) Metabolic enzyme profile in A549 cells under inhibition of classes I/II/IV KDAC by 1 μM of TSA for 24 h incubation under normoxic conditions. (B) Metabolic enzymes regulation in A549 cells under sirtuin inhibition by 20 mM NAM for 24 h incubation under normoxic conditions. (C) Metabolic enzymes regulation in A549 cells under hypoxic conditions for 24 h incubation. (D) Metabolic enzymes regulation in A549 cells under inhibition of both classes I/II/IV KDAC and sirtuins by 1 μM TSA and 20 mM NAM for 24 h incubation under hypoxic conditions. AcCoA: Acetyl-CoA; ACSL3: Long-chain-fatty-acid-CoA ligase 3; ALDC: Fructose-bisphosphate aldolase C; ALDH10: Fatty aldehyde dehydrogenase; COX6A1: Cytochrome c oxidase subunit 6A1; ENO1: Alpha-enolase; Glc: Glucose; Gln: Glutamine; KDAC: Lysine deacetylases; Lac: Lactate; LDH-B: Lactate dehydrogenase B; NAM: Nicotinamide; OGDH: 2-oxoglutarate dehydrogenase, mitochondrial; OXPHOS: Oxidative Phosphorylation; Pyr: Pyruvate; PDHE: Pyruvate dehydrogenase E1; PFK1: ATP-dependent 6-phosphofructokinase 1, liver type; Pyr: Pyruvate; SIRT: Sirtuins; SRM: Spermidine synthase; TCA: tricarboxylic acid; TECR: Very-long-chain enoyl-CoA reductase; TSA: Trichostatin A; TXNDC17: Thioredoxin domain-containing protein 17; TXNDC5: Thioredoxin domain-containing protein Our machine learning analysis revealed a list of chemotherapeutic agents, including doxorubicin, paclitaxel, etoposide, tamoxifen, bortezomib, 5-fluorouracil, methotrexate, imatinib, gemcitabine and metformin that may target proteins affected by KDAC inhibition under hypoxia in KRAS mutated NSCLC A549 cells.
Figure 8
Figure 8
Schematic workflow of the proteomic approach used in the present study. A549 cells were treated with 1 μM of TSA, 20 mM of NAM and both 1 μM TSA and 20 mM NAM for 24 h under normoxia and hypoxia. Cells incubated in medium without KDACIs served as control. Cell lysates were processed according to the filter-aided sample preparation (FASP) protocol. Digested peptides of each treatment group were labeled with iTRAQ tags and separated in a 2-step fractionation. Fraction peptides were spotted on MALDI plates using a spotting system. Mass spectrometer 4800 MALDI TOF/TOF analyzer was used to collect MS and MS/MS data for identify and quantify proteins. iTRAQ ratios were quantified and validated. Proteins with iTRAQ ratios > 1 and a p-value ≤ 0.05 were considered to be significantly increased whereas proteins with iTRAQ ratios < 1 and a p-value ≤ 0.05 were considered to be significantly decreased.

Similar articles

Cited by

References

    1. Bray F., Ferlay J., Soerjomataram I., Siegel R.L., Torre L.A., Jemal A. Global Cancer Statistics 2018: GLOBOCAN Estimates of Incidence and Mortality Worldwide for 36 Cancers in 185 Countries. CA Cancer J. Clin. 2018;68:394–424. doi: 10.3322/caac.21492. - DOI - PubMed
    1. Siegel R.L., Miller K.D., Jemal A. Cancer statistics. CA Cancer J. Clin. 2020;70:7–30. doi: 10.3322/caac.21590. - DOI - PubMed
    1. Dasari S., Tchounwou P.B. Cisplatin in cancer therapy: Molecular mechanisms of action. Eur. J. Pharmacol. 2014;740:364–378. doi: 10.1016/j.ejphar.2014.07.025. - DOI - PMC - PubMed
    1. Lim Z.-F., Ma P.C. Emerging insights of tumor heterogeneity and drug resistance mechanisms in lung cancer targeted therapy. J. Hematol. Oncol. 2019;12:1–18. doi: 10.1186/s13045-019-0818-2. - DOI - PMC - PubMed
    1. Jeannot V., Busser B., Brambilla E., Wislez M., Robin B., Cadranel J., Coll J.-L., Hurbin A. The PI3K/AKT pathway promotes gefitinib resistance in mutant KRAS lung adenocarcinoma by a deacetylase-dependent mechanism. Int. J. Cancer. 2013;134:2560–2571. doi: 10.1002/ijc.28594. - DOI - PubMed