. 2021 Mar 4;10(3):558.
doi: 10.3390/cells10030558.

Oxidized Phospholipids in Tumor Microenvironment Stimulate Tumor Metastasis via Regulation of Autophagy

Affiliations

Oxidized Phospholipids in Tumor Microenvironment Stimulate Tumor Metastasis via Regulation of Autophagy

Jin Kyung Seok et al. Cells. .

Abstract

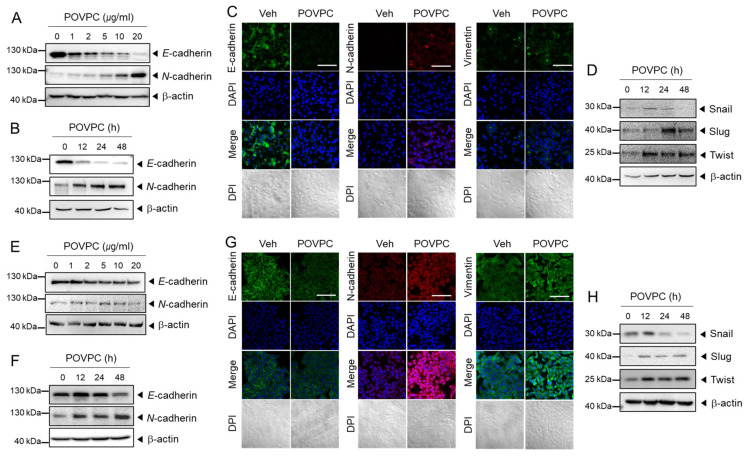
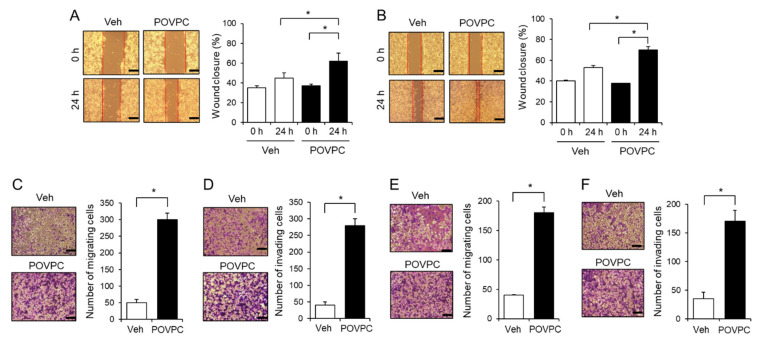
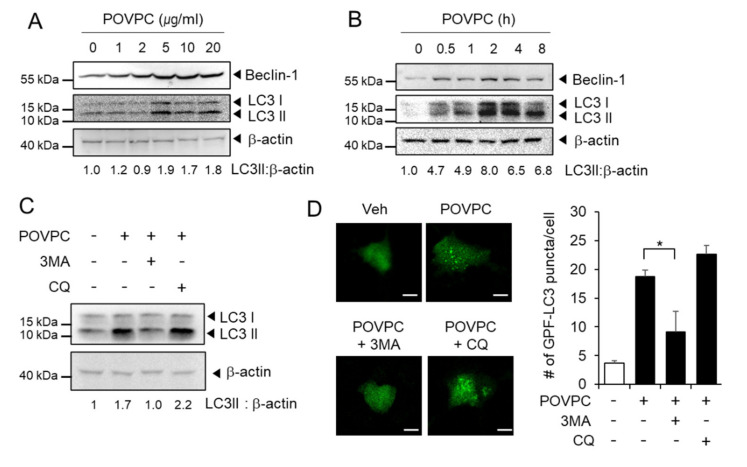
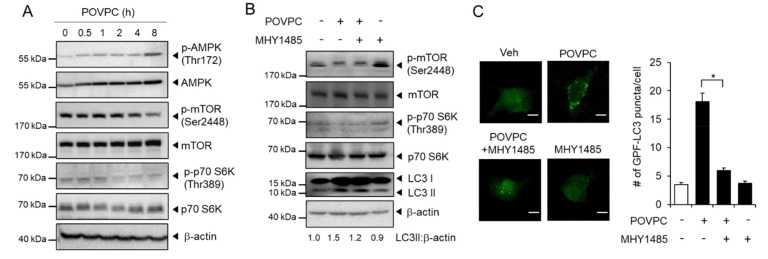
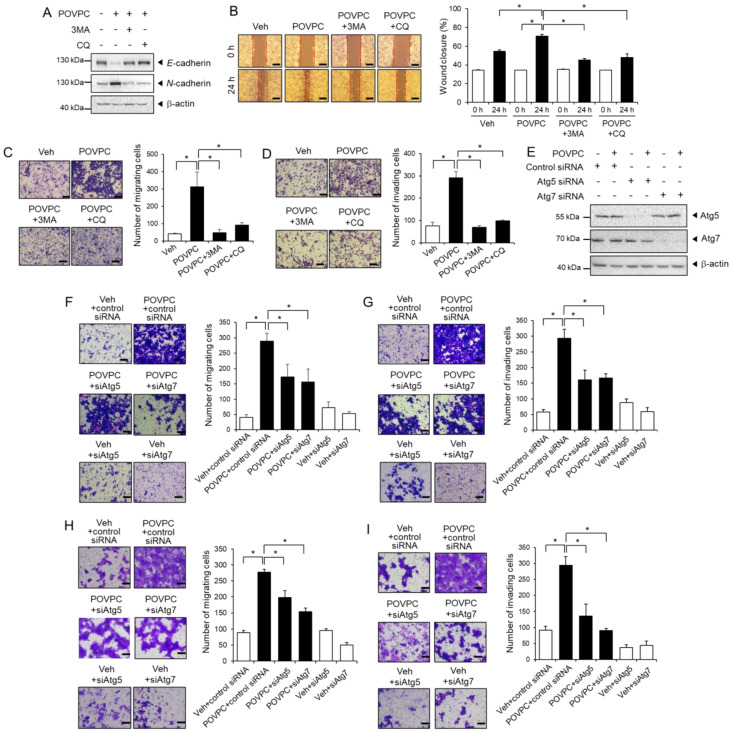
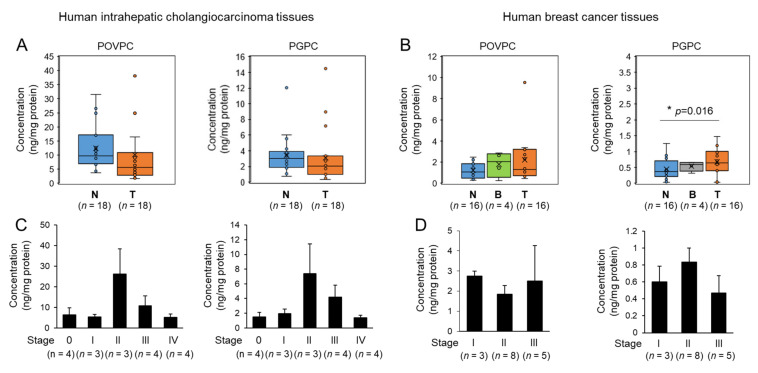
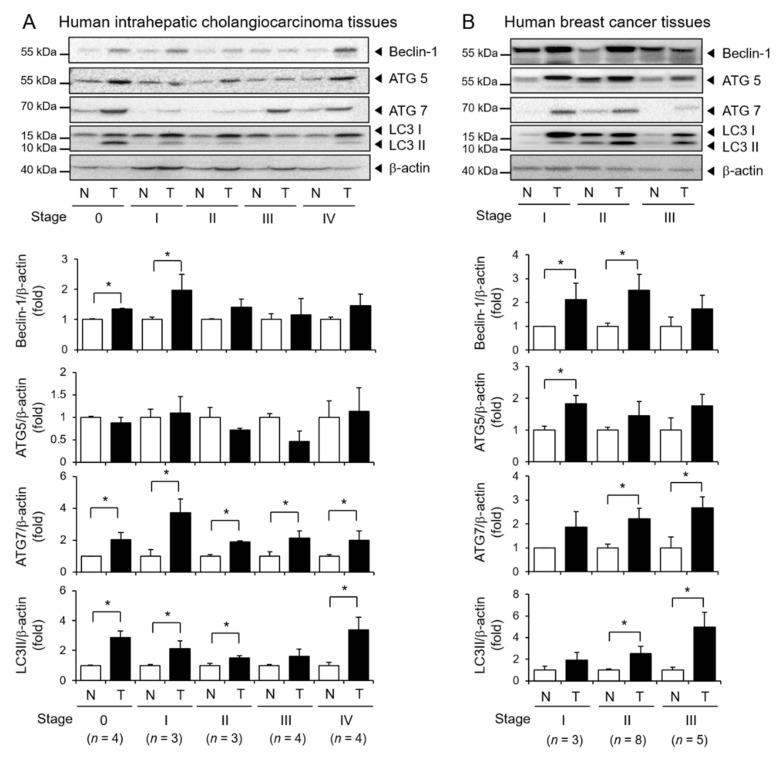
Oxidized phospholipids are well known to play physiological and pathological roles in regulating cellular homeostasis and disease progression. However, their role in cancer metastasis has not been entirely understood. In this study, effects of oxidized phosphatidylcholines such as 1-palmitoyl-2-(5-oxovaleroyl)-sn-glycero-3-phosphocholine (POVPC) on epithelial-mesenchymal transition (EMT) and autophagy were determined in cancer cells by immunoblotting and confocal analysis. Metastasis was analyzed by a scratch wound assay and a transwell migration/invasion assay. The concentrations of POVPC and 1-palmitoyl-2-glutaroyl-sn-glycero-phosphocholine (PGPC) in tumor tissues obtained from patients were measured by LC-MS/MS analysis. POVPC induced EMT, resulting in increase of migration and invasion of human hepatocellular carcinoma cells (HepG2) and human breast cancer cells (MCF7). POVPC induced autophagic flux through AMPK-mTOR pathway. Pharmacological inhibition or siRNA knockdown of autophagy decreased migration and invasion of POVPC-treated HepG2 and MCF7 cells. POVPC and PGPC levels were greatly increased at stage II of patient-derived intrahepatic cholangiocarcinoma tissues. PGPC levels were higher in malignant breast tumor tissues than in adjacent nontumor tissues. The results show that oxidized phosphatidylcholines increase metastatic potential of cancer cells by promoting EMT, mediated through autophagy. These suggest the positive regulatory role of oxidized phospholipids accumulated in tumor microenvironment in the regulation of tumorigenesis and metastasis.

Keywords: autophagy; cancer; metastasis; oxidative stress; phospholipids.


Conflict of interest statement

The authors declare that they have no competing interests.

Figures

Figure 1
Figure 1
1-palmitoyl-2-(5-oxovaleroyl)-sn-glycero-3-phosphocholine (POVPC) induces changes in epithelial-mesenchymal transition marker expression in cancer cells. (A,B) HepG2 cells were treated with (A) the specified doses of POVPC for 48 h and (B) 5 µg/mL of POVPC for the indicated periods. The levels of EMT-related protein markers were determined by immunoblotting with β-actin as the loading control. (C) HepG2 cells were treated with 5 µg/mL of POVPC for 48 h. Expression of E-cadherin (green), N-cadherin (red), and vimentin (green) was determined using confocal immunofluorescence microscopy. Cells were identified by DAPI staining of the nuclei (blue). The scale bar represents 100 μm. (D) HepG2 cells were treated with 5 µg/mL of POVPC for the indicated periods. The levels of transcription factors (Snail, Slug, and Twist) were determined by immunoblotting with β-actin as the loading control. (E,F) MCF7 cells were treated with (E) the specified doses of POVPC for 48 h and (F) 5 µg/mL of POVPC for the indicated periods. The protein levels of EMT-related markers were determined by immunoblotting with β-actin as the loading control. (G) MCF7 cells were treated with 5 µg/mL of POVPC for 48 h and processed as described in C. (H) MCF7 cells were treated with 5 µg/mL of POVPC for the indicated periods and processed as described in (D).
Figure 2
Figure 2
POVPC enhances the migration and invasion abilities of cancer cells. (A) HepG2 cells or (B) MCF7 cells were wounded with a single scratch in the presence of POVPC (5 µg/mL) for 24 h. Wound closure was determined using customized ImageJ software, and the percentage of wound closure compared to unstimulated cells was calculated. The scale bar represents 100 μm. (C, D) Migration or invasion of HepG2 cells was measured using a Transwell system after treatment with POVPC (5 µg/mL) for 24 h. (E,F) Migration or invasion of MCF7 cells was measured using a Transwell system after treatment with POVPC (5 µg/mL) for 24 h. Values in the line graphs represent the mean ± SEM (n = 3). * p < 0.05.
Figure 3
Figure 3
POVPC induces autophagic flux in cancer cells. (A) HepG2 cells were treated with the specified doses of POVPC for 8 h. (B) MCF7 cells were treated with 5 µg/mL of POVPC for the indicated time periods. Proteins were determined by immunoblotting as indicated with β-actin as the loading control. (C) HepG2 cells were pretreated with 3-methyladenine (3MA, 10 mM) and chloroquine (CQ, 5 µM) for 1 h and then treated with 5 µg/mL of POVPC for 8 h. The levels of LC3 were determined by immunoblotting. + means corresponding treatment and - means vehicle treatment. (D) HepG2 cells expressing GFP-LC3 were pretreated with 3MA (10 mM) or CQ (5 µM) for 1 h and then treated with 5 µg/mL of POVPC for 8 h. The representative fluorescence images are presented (left). The scale bar represents 20 μm. The bar graph shows the number of GFP-LC3 puncta in each cell (right). Values in line graphs represent the mean ± SEM (n = 3). *, p < 0.05.
Figure 4
Figure 4
POVPC-induced autophagic flux is mediated through the AMPK-mTOR pathway. (A) HepG2 cells were treated with 5 µg/mL of POVPC for the indicated time periods. The levels of each protein were determined by immunoblotting as indicated with β-actin as the loading control. (B) HepG2 cells were treated with MHY1485 (10 µM) and/or POVPC (5 µg/mL) as indicated for 8 h. The levels of each protein were determined by immunoblotting as indicated with β-actin as the loading control. + means corresponding treatment and - means vehicle treatment. (C) HepG2 cells expressing GFP-LC3 were treated with MHY1485 (10 µM) and/or POVPC (5 µg/mL) for 8 h. The representative fluorescence images are presented (left). The scale bar represents 20 μm. The bar graph shows the number of GFP-LC3 puncta in each cell (right). Values in the line graphs represent the mean ± SEM (n = 3). *, p < 0.05.
Figure 5
Figure 5
The pro-metastatic effects of POVPC are mediated through the autophagic pathway. (A) HepG2 cells were treated with POVPC (5 µg/mL) in the presence or absence of autophagy inhibitors, 3MA (10 mM) or CQ (5 µM), for 24 h. The levels of EMT-related protein markers were determined by immunoblotting with β-actin as the loading control. (B) HepG2 cells were wounded with a single scratch and treated with POVPC (5 µg/mL) in the presence or absence of autophagy inhibitors, 3MA (10 mM) or CQ (5 µM), for 24 h. Wound closure was determined using customized ImageJ software and the percentage of wound closure compared to unstimulated cells was calculated. (C,D) Migration or invasion of HepG2 cells was measured using a Transwell system after treatment with POVPC (5 µg/mL) in the presence or absence of autophagy inhibitors, 3MA (10 mM) or CQ (5 µM), for 24 h. (E) Knockdown of ATG5 and ATG7 expression in HepG2 cells using siRNA was determined by immunoblotting. (FI) HepG2 cells (F, G) and MCF7 cells (H, I) were transfected with negative control siRNA, siRNA for ATG5, or siRNA for ATG7 and treated with POVPC (5 µg/mL) for 24 h. Migration or invasion of HepG2 cells and MCF7 cells was measured using a Transwell system. The scale bar represents 100 μm. For A and E, + means corresponding treatment and - means vehicle treatment. Values in the line graphs represent the mean ± SEM (n = 3). *, p < 0.05.
Figure 6
Figure 6
The levels of 1-palmitoyl-2-glutaroyl-sn-glycero-phosphocholine (PGPC) and POVPC in patient-derived tumor tissues and nontumor tissues. (A,B) POVPC and PGPC quantities were determined by LC-MS/MS analysis in (A) human intrahepatic cholangiocarcinoma tissues (T) and adjacent nontumor tissues (N); (B) human breast tumor tissues (T), benign tumor tissues (B), and adjacent nontumor tissues (N). The bar represents means± SEM. Dots represent individual values. (C,D) The levels of POVPC and PGPC were determined by LC-MS/MS analysis in different stages of tumors. The bar represents means ± SEM.
Figure 7
Figure 7
The expression of autophagy markers in patient-derived tumor tissues and nontumor tissues. (A) Five pairs of human intrahepatic cholangiocarcinoma tissues in different stages and nontumor tissues were analyzed for autophagy marker expression by immunoblotting. The density was measured and expressed as bar graphs. Values represent (B) Three pairs of human breast tumor tissues in different stages and nontumor tissues were analyzed for autophagy marker expression by immunoblotting. β-actin was used as the loading control. For A and B, density was measured and expressed as bar graphs. Values represent means± SEM (n = 3). * p < 0.05.

Similar articles

Cited by

References

    1. Guan X. Cancer metastases: Challenges and opportunities. Acta Pharm. Sin. B. 2015;5:402–418. doi: 10.1016/j.apsb.2015.07.005. - DOI - PMC - PubMed
    1. Ye X., Weinberg R.A. Epithelial–Mesenchymal Plasticity: A Central Regulator of Cancer Progression. Trends Cell Biol. 2015;25:675–686. doi: 10.1016/j.tcb.2015.07.012. - DOI - PMC - PubMed
    1. Kaur J., Debnath J. Autophagy at the crossroads of catabolism and anabolism. Nat. Rev. Mol. Cell Biol. 2015;16:461–472. doi: 10.1038/nrm4024. - DOI - PubMed
    1. Kenific C.M., Thorburn A., Debnath J. Autophagy and metastasis: Another double-edged sword. Curr. Opin. Cell Biol. 2010;22:241–245. doi: 10.1016/j.ceb.2009.10.008. - DOI - PMC - PubMed
    1. Kondo Y., Kanzawa T., Sawaya R., Kondo S. The role of autophagy in cancer development and response to therapy. Nat. Rev. Cancer. 2005;5:726–734. doi: 10.1038/nrc1692. - DOI - PubMed

Publication types

LinkOut - more resources