

Parallel Multi-Omics in High-Risk Subjects for the Identification of Integrated Biomarker Signatures of Type 1 Diabetes
- PMID: 33806609
- PMCID: PMC7999903
- DOI: 10.3390/biom11030383
Parallel Multi-Omics in High-Risk Subjects for the Identification of Integrated Biomarker Signatures of Type 1 Diabetes
Abstract
Background: Biomarkers are crucial for detecting early type-1 diabetes (T1D) and preventing significant β-cell loss before the onset of clinical symptoms. Here, we present proof-of-concept studies to demonstrate the potential for identifying integrated biomarker signature(s) of T1D using parallel multi-omics.
Methods: Blood from human subjects at high risk for T1D (and healthy controls; n = 4 + 4) was subjected to parallel unlabeled proteomics, metabolomics, lipidomics, and transcriptomics. The integrated dataset was analyzed using Ingenuity Pathway Analysis (IPA) software for disturbances in the at-risk subjects compared to controls.
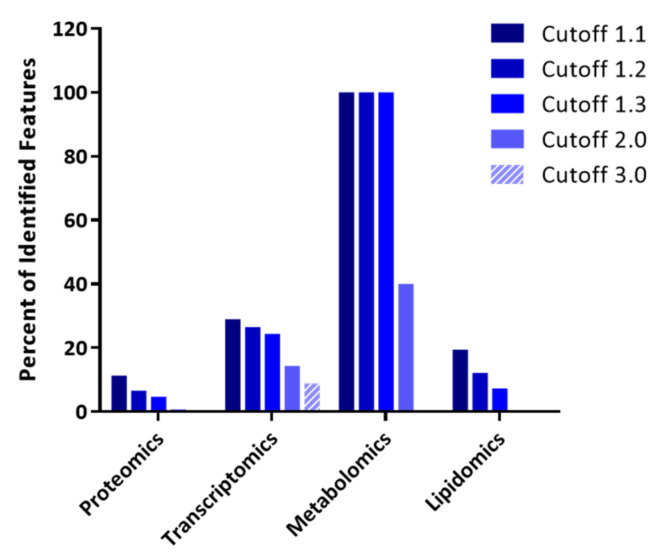
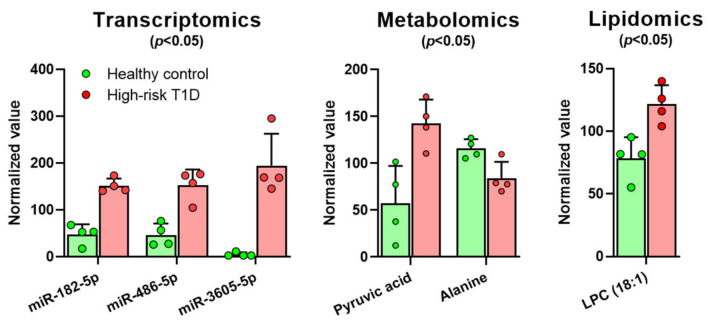
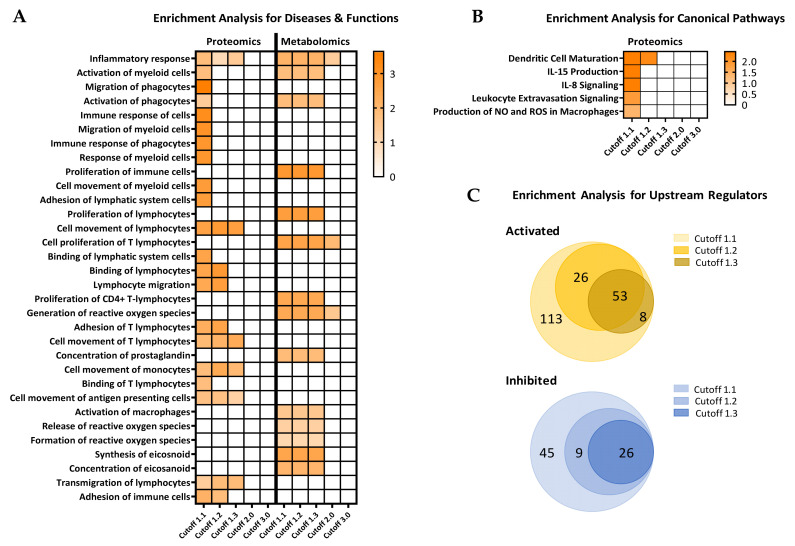
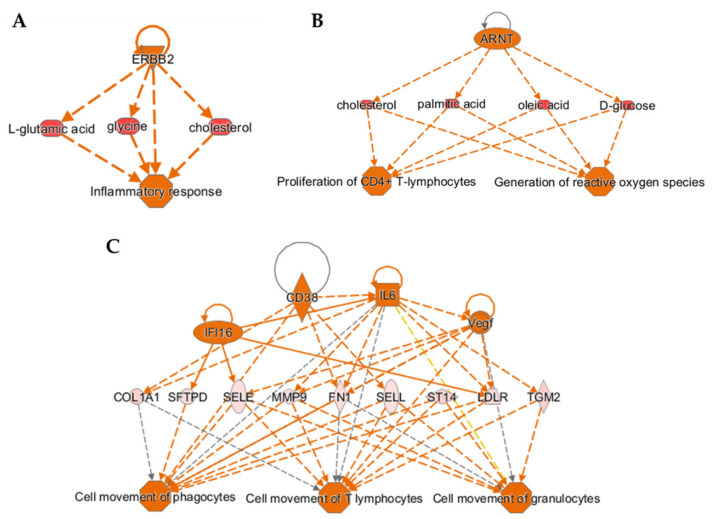
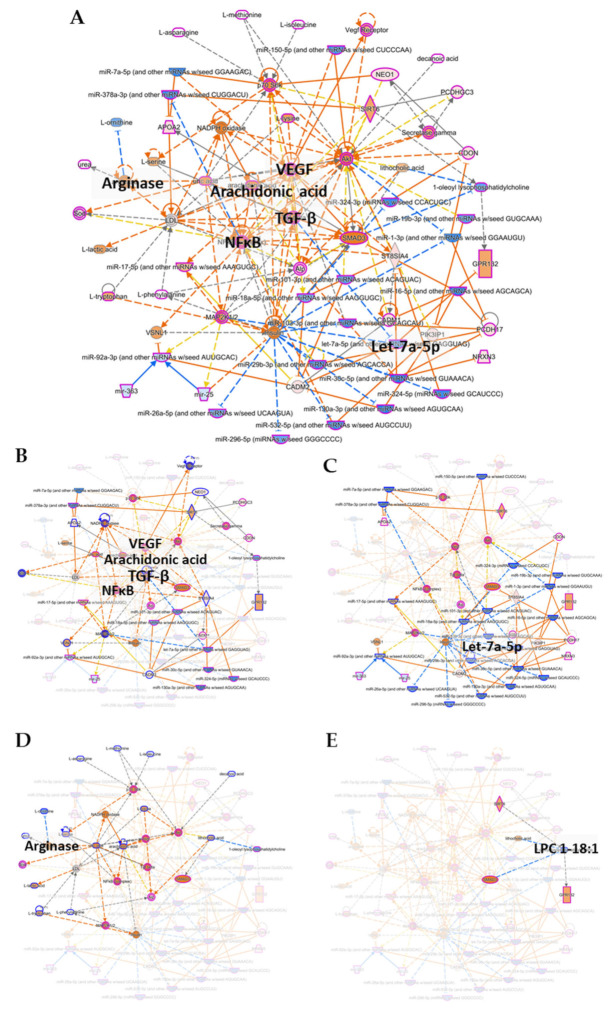
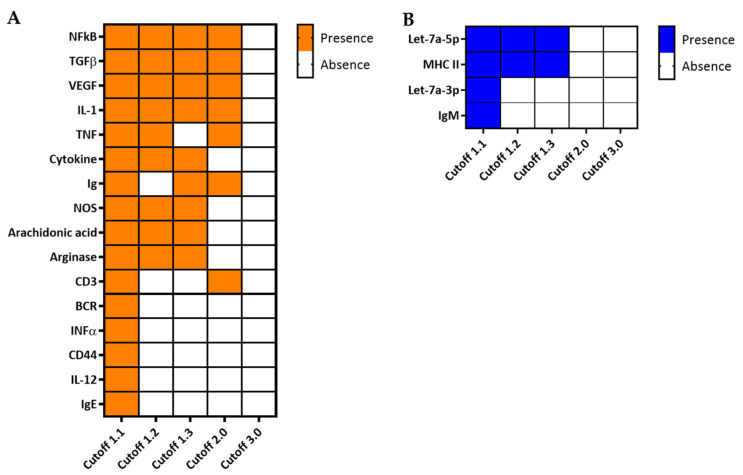
Results: The final quadra-omics dataset contained 2292 proteins, 328 miRNAs, 75 metabolites, and 41 lipids that were detected in all samples without exception. Disease/function enrichment analyses consistently indicated increased activation, proliferation, and migration of CD4 T-lymphocytes and macrophages. Integrated molecular network predictions highlighted central involvement and activation of NF-κB, TGF-β, VEGF, arachidonic acid, and arginase, and inhibition of miRNA Let-7a-5p. IPA-predicted candidate biomarkers were used to construct a putative integrated signature containing several miRNAs and metabolite/lipid features in the at-risk subjects.
Conclusions: Preliminary parallel quadra-omics provided a comprehensive picture of disturbances in high-risk T1D subjects and highlighted the potential for identifying associated integrated biomarker signatures. With further development and validation in larger cohorts, parallel multi-omics could ultimately facilitate the classification of T1D progressors from non-progressors.
Keywords: biomarker signature; biomarkers; diagnosis; early prediction; integrated analysis; lipidomics; metabolomics; multi-omics; network prediction; omics; prognosis; proteomics; signaling pathways; transcriptomics; type 1 diabetes.
Conflict of interest statement
The authors declare no conflict of interest associated with their contribution to this manuscript. The funders had no role in the design of the study; in the collection, analyses, or interpretation of data; in the writing of the manuscript, or in the decision to publish the results.
Figures
Similar articles
-
Exploring Computational Data Amplification and Imputation for the Discovery of Type 1 Diabetes (T1D) Biomarkers from Limited Human Datasets.Biomolecules. 2022 Oct 9;12(10):1444. doi: 10.3390/biom12101444. Biomolecules. 2022. PMID: 36291653 Free PMC article.
-
Metabolomics and Lipidomics Studies in Pediatric Type 1 Diabetes: Biomarker Discovery for the Early Diagnosis and Prognosis.Pediatr Diabetes. 2023 Jul 13;2023:6003102. doi: 10.1155/2023/6003102. eCollection 2023. Pediatr Diabetes. 2023. PMID: 40303249 Free PMC article. Review.
-
Integrating Omics into Functional Biomarkers of Type 1 Diabetes.Cold Spring Harb Perspect Med. 2024 Jul 1;14(7):a041602. doi: 10.1101/cshperspect.a041602. Cold Spring Harb Perspect Med. 2024. PMID: 38772709 Review.
-
Exploring the "gene-protein-metabolite" network of coronary heart disease with phlegm and blood stasis syndrome by integrated multi-omics strategy.Front Pharmacol. 2022 Nov 29;13:1022627. doi: 10.3389/fphar.2022.1022627. eCollection 2022. Front Pharmacol. 2022. PMID: 36523490 Free PMC article.
-
Multi-omics technologies and molecular biomarkers in brain tumor-related epilepsy.CNS Neurosci Ther. 2024 Apr;30(4):e14717. doi: 10.1111/cns.14717. CNS Neurosci Ther. 2024. PMID: 38641945 Free PMC article. Review.
Cited by
-
Personalized Immunotherapies for Type 1 Diabetes: Who, What, When, and How?J Pers Med. 2022 Mar 29;12(4):542. doi: 10.3390/jpm12040542. J Pers Med. 2022. PMID: 35455658 Free PMC article. Review.
-
Application of Metabolomics in Various Types of Diabetes.Diabetes Metab Syndr Obes. 2022 Jul 13;15:2051-2059. doi: 10.2147/DMSO.S370158. eCollection 2022. Diabetes Metab Syndr Obes. 2022. PMID: 35860310 Free PMC article. Review.
-
Protocol for a nested case-control study design for omics investigations in the Environmental Determinants of Islet Autoimmunity cohort.Ann Med. 2023 Dec;55(1):2198255. doi: 10.1080/07853890.2023.2198255. Ann Med. 2023. PMID: 37043275 Free PMC article.
-
Epigenomics and Lipidomics Integration in Alzheimer Disease: Pathways Involved in Early Stages.Biomedicines. 2021 Dec 2;9(12):1812. doi: 10.3390/biomedicines9121812. Biomedicines. 2021. PMID: 34944628 Free PMC article.
-
Multi-omics of NET formation and correlations with CNDP1, PSPB, and L-cystine levels in severe and mild COVID-19 infections.Heliyon. 2023 Mar;9(3):e13795. doi: 10.1016/j.heliyon.2023.e13795. Epub 2023 Mar 7. Heliyon. 2023. PMID: 36915486 Free PMC article.
References
-
- Chast F., Slama G. [Apollinaire Bouchardat and diabetes] Hist. Sci. Med. 2007;41:287–301. - PubMed
-
- Best C.H. The internal secretion of the pancreas. J. Am. Med. Assoc. 1935;105:270–274. doi: 10.1001/jama.1935.92760300002008. - DOI
-
- Colli M.L., Hill J.L.E., Marroquí L., Chaffey J., Dos Santos R.S., Leete P., Coomans de Brachène A., Paula F.M.M., Op de Beeck A., Castela A., et al. PDL1 is expressed in the islets of people with type 1 diabetes and is up-regulated by interferons-α and-γ via IRF1 induction. EBioMedicine. 2018;36:367–375. doi: 10.1016/j.ebiom.2018.09.040. - DOI - PMC - PubMed
Publication types
MeSH terms
Substances
Grants and funding
LinkOut - more resources
Full Text Sources
Other Literature Sources
Medical
Research Materials
