. 2021 Mar 23;22(6):3249.
doi: 10.3390/ijms22063249.

Role of the ROS-JNK Signaling Pathway in Hypoxia-Induced Atrial Fibrotic Responses in HL-1 Cardiomyocytes

Affiliations

Role of the ROS-JNK Signaling Pathway in Hypoxia-Induced Atrial Fibrotic Responses in HL-1 Cardiomyocytes

Chin-Feng Tsai et al. Int J Mol Sci. .

Abstract

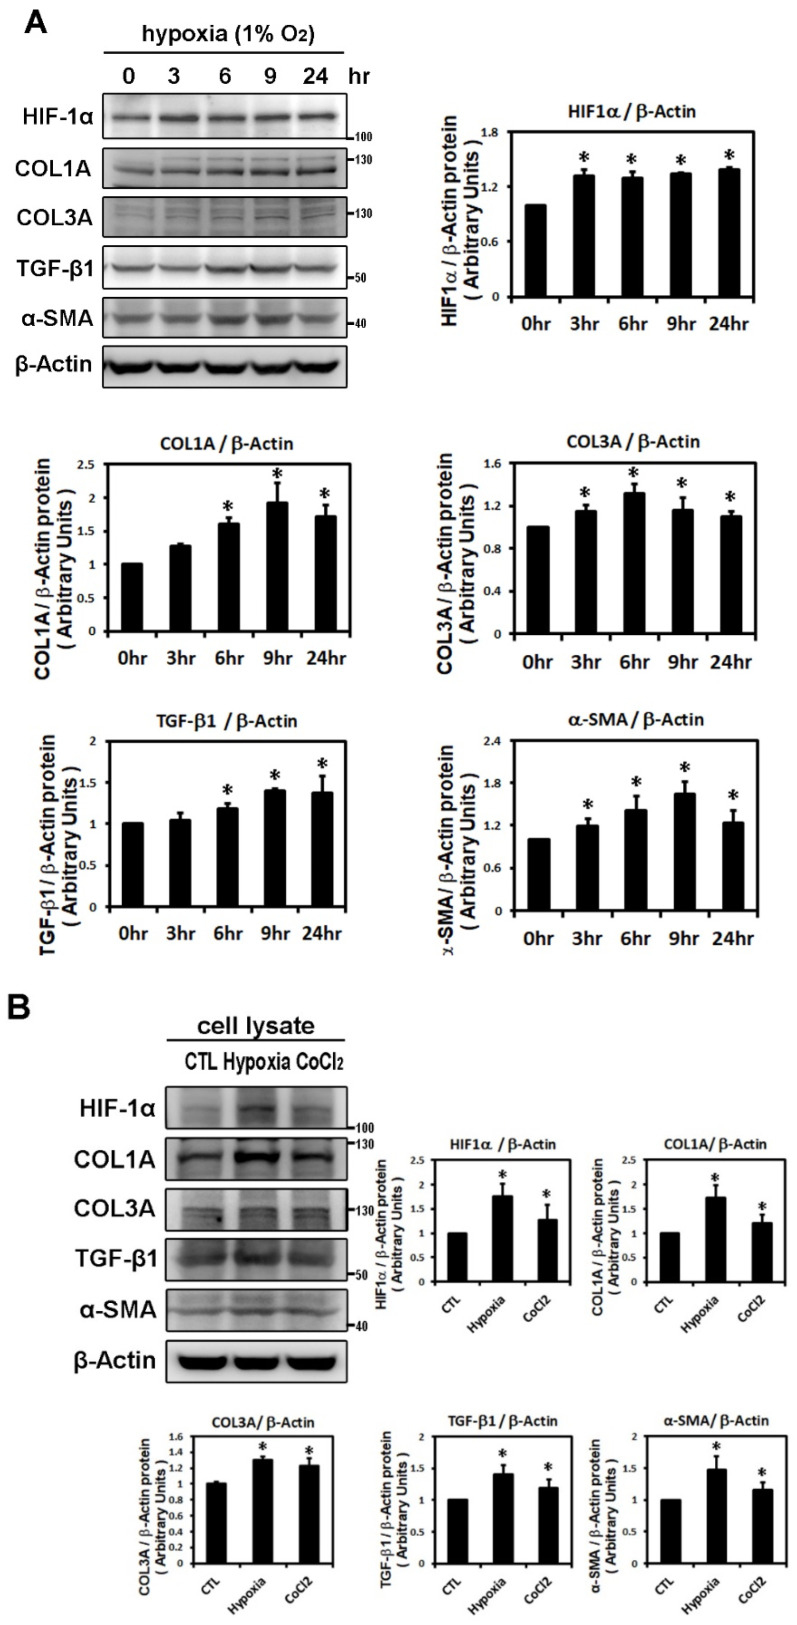
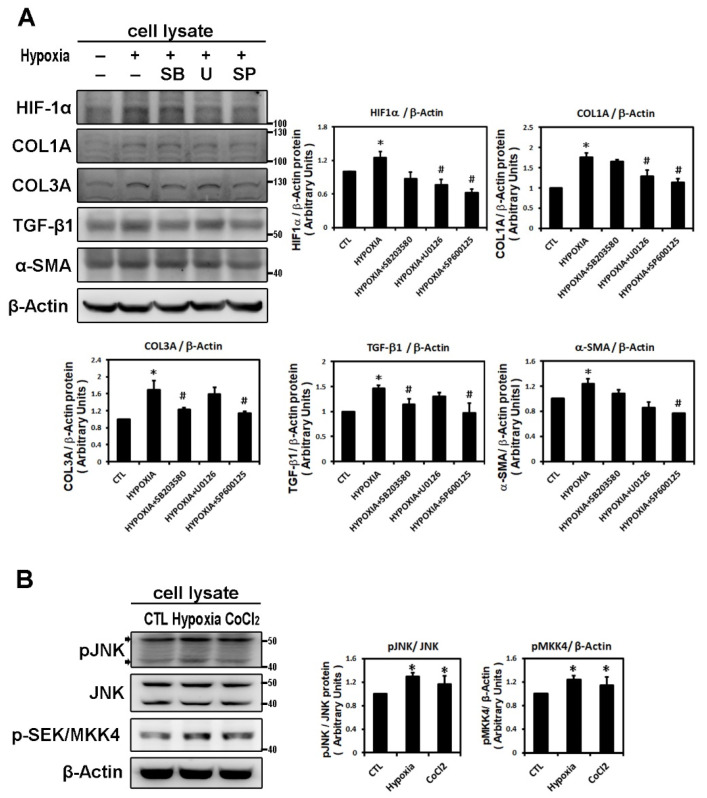
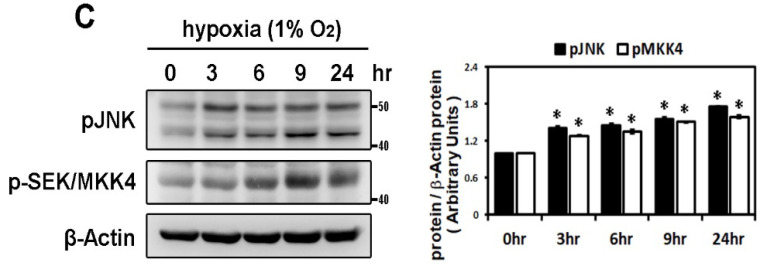
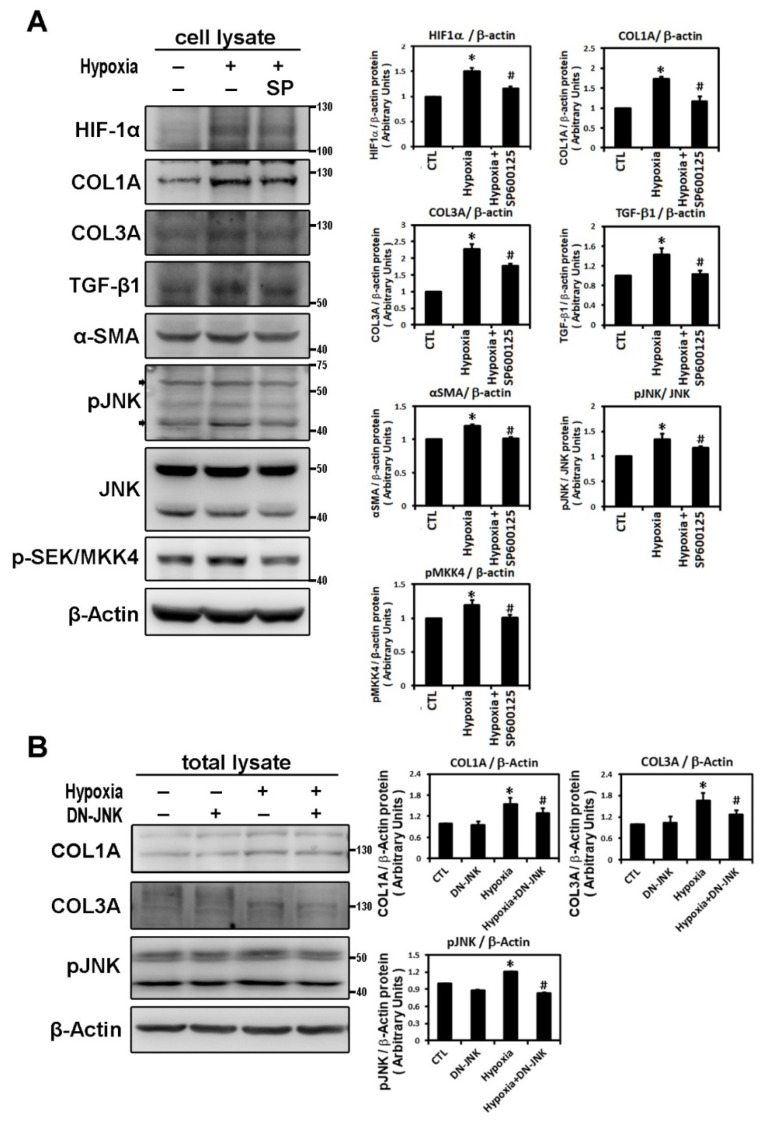
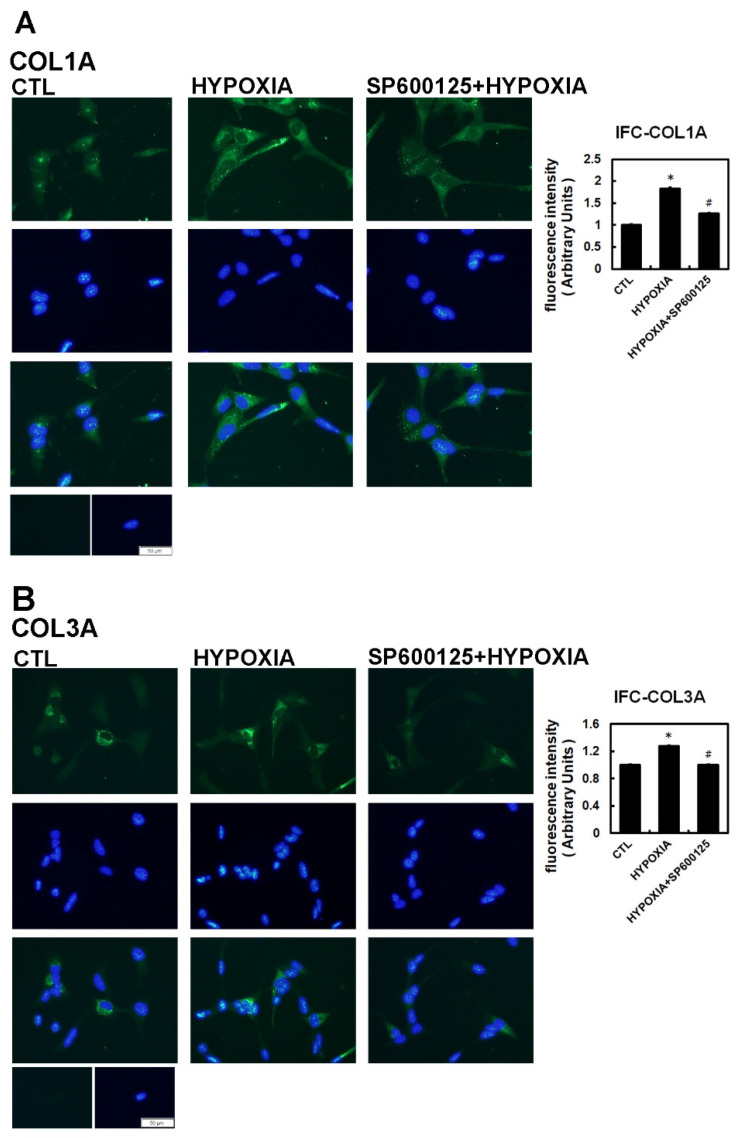
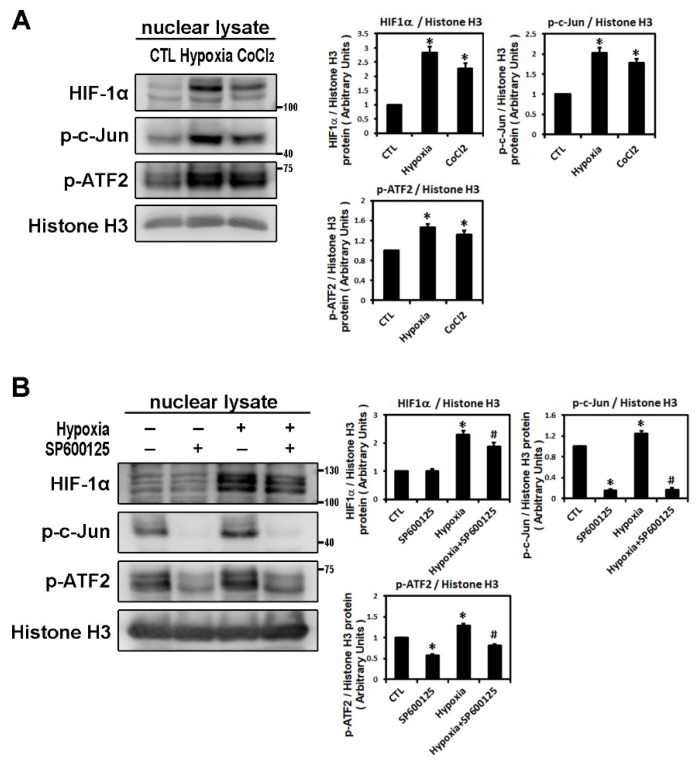
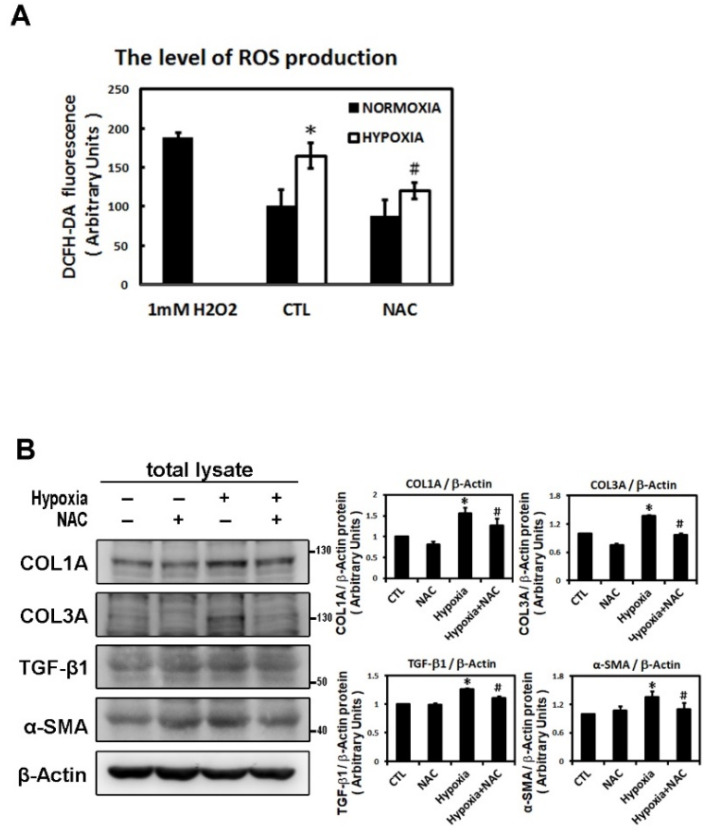
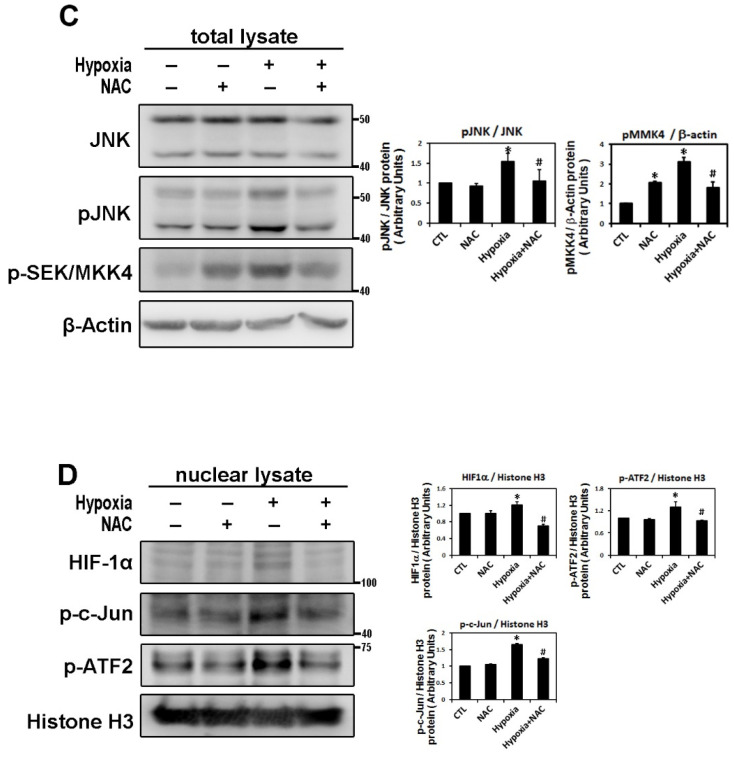
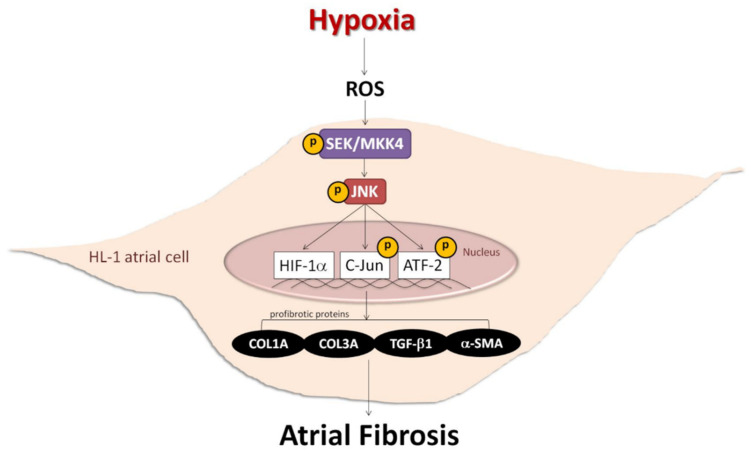
By promoting atrial structural remodeling, atrial hypoxia contributes to the development of the atrial fibrillation substrate. Our study aimed to investigate the modulatory effect of hypoxia on profibrotic activity in cultured HL-1 cardiomyocytes and explore the possible signaling transduction mechanisms of profibrotic activity in vitro. Hypoxia (1% O2) significantly and time-dependently increased the expression of hypoxia-inducible factor (HIF)-1α and fibrotic marker proteins collagen I and III (COL1A and COL3A), transforming growth factor (TGF)-β1 and α-smooth muscle actin (SMA). Western blot or immunohistochemistry analysis showed that hypoxia-induced increase in COL1A and COL3A was significantly attenuated by the addition of SP600125 (a specific c-Jun N-terminal kinase [JNK] inhibitor) or expression of dominant-negative JNK before hypoxia treatment. The inhibition of hypoxia-activated phosphorylation of JNK signal components (JNK, MKK4, nuclear c-Jun and ATF-2) by pre-treatment with SP600125 could suppress hypoxia-stimulated HIF-1α upregulation and fibrotic marker proteins expression. Hypoxia significantly increased reactive oxygen species (ROS) production in cultured HL-1 atrial cells. Pre-treatment with N-acetylcysteine significantly abrogated the expression of nuclear HIF-1α, JNK transduction components and fibrotic marker proteins. Taken together, these findings indicated that the hypoxia-induced atrial profibrotic response occurs mainly via the ROS/JNK pathway, its downstream upregulation of HIF-1α and c-Jun/ATF2 phosphorylation and nuclear translocation to up-regulate the expression of fibrosis-related proteins (COL1A, COL3A, TGF-β1 and α-SMA). Our result suggests that suppression of ROS/JNK signaling pathway is a critical mechanism for developing a novel therapeutic strategy against atrial fibrillation.

Keywords: atrial fibrillation; fibrosis; hypoxia; signal transduction.


Conflict of interest statement

The authors declare no conflict of interest.

Figures

Figure 1
Figure 1
Effects of hypoxic treatment on the expression of HIF-1α and profibrotic proteins. Expression of the indicated proteins in cellular homogenates was measured by Western blot. Each lane contained a total of 25 μg of protein and the blots were probed with the indicated antibody. All data were normalized to the β-actin loading and blotting control. Bar graphs indicate band intensity as determined by densitometry and the fold increase in intensity over control. Panel A: Exposure of cultured HL-1 cells to hypoxia (1% O2) for the indicated times resulted in time-dependently increased protein levels of HIF-1α (maximum reached at 3 h), COL3A (maximum reached at 6 h) and TGF-β1, α-SMA, COL1A (maxima reached at 9 h). Panel B: Representative Western blots and quantitative analysis of protein levels of HIF-1α and fibrosis-related proteins (COL1A, COL3A, TGF-β1, α-SMA) in HL-1 cells treated with hypoxia (1% O2) or CoCl2 (10−4 M) for 6 h. The data are mean ± SEM (n = 4 per group, * p < 0.05 vs. control) from four independent experiments.
Figure 2
Figure 2
Panel A: Effect of MAPK inhibitors on the expression of hypoxia-induced HIF-1α and profibrotic proteins. Whole cell lysates of HL-1 cells pre-incubated with SB203580 (10−5 M), U0126 (10−5 M), SP600125 (10−5 M) or DMSO as a vehicle for 30 min, then treated with hypoxia stress (1% O2) for 6 h, were analyzed by Western blots to determine the levels of HIF-1α and fibrosis-related proteins (COL1A, COL3A, TGF-β1, α-SMA) expression. The bar graph shows the value of each sample relative to that of control cells that received vehicle only. The data are mean ± SEM (n = 4 per group, * p < 0.05 vs. control; # p < 0.05 vs. hypoxia) from four independent experiments. Panel B: Effect of hypoxic treatment on phosphorylated JNK signals. Representative Western blots and protein levels of JNK, phosphorylated JNK and SEK/MKK4 in HL-1 cells treated with hypoxia (1% O2) or CoCl2 (10−4 M) for 6 h. Panel C: Exposure of cultured HL-1 cells to hypoxia (1% O2) for the indicated times resulted in time-dependently increased protein levels of phosphorylated JNK and SEK/MKK4. The data are mean ± SEM (n = 4 per group, * p < 0.05 vs. control) from four independent experiments.
Figure 2
Figure 2
Panel A: Effect of MAPK inhibitors on the expression of hypoxia-induced HIF-1α and profibrotic proteins. Whole cell lysates of HL-1 cells pre-incubated with SB203580 (10−5 M), U0126 (10−5 M), SP600125 (10−5 M) or DMSO as a vehicle for 30 min, then treated with hypoxia stress (1% O2) for 6 h, were analyzed by Western blots to determine the levels of HIF-1α and fibrosis-related proteins (COL1A, COL3A, TGF-β1, α-SMA) expression. The bar graph shows the value of each sample relative to that of control cells that received vehicle only. The data are mean ± SEM (n = 4 per group, * p < 0.05 vs. control; # p < 0.05 vs. hypoxia) from four independent experiments. Panel B: Effect of hypoxic treatment on phosphorylated JNK signals. Representative Western blots and protein levels of JNK, phosphorylated JNK and SEK/MKK4 in HL-1 cells treated with hypoxia (1% O2) or CoCl2 (10−4 M) for 6 h. Panel C: Exposure of cultured HL-1 cells to hypoxia (1% O2) for the indicated times resulted in time-dependently increased protein levels of phosphorylated JNK and SEK/MKK4. The data are mean ± SEM (n = 4 per group, * p < 0.05 vs. control) from four independent experiments.
Figure 3
Figure 3
Hypoxia activates the JNK pathway to modulate fibrosis-related proteins expression. Panel A: Effect of JNK pathway inhibitor on the hypoxia-induced expression of indicated protein. Representative Western blots and levels of HIF-1α, fibrosis-related proteins (COL1A, COL3A, TGF-β1, α-SMA) and phosphorylated JNK and SEK/MKK4 in HL-1 cells that were pre-incubated with SP600125 (10−5 M) or DMSO as a vehicle for 30 min, then treated with hypoxia stress (1% O2) for 6 h. The bar graph shows the value of each sample relative to that of control cells that received vehicle only. The data are mean ± SEM (n = 4 per group, * p < 0.05 vs. control; # p < 0.05 vs. hypoxia) from four independent experiments. Panel B: Dominant-negative-JNK (DN-JNK) gene transfection attenuated hypoxia-induced COL1A, COL3A and p-JNK expression in HL-1 cells. Representative Western blots and COL1A and COL3A levels in HL-1 cells transfected with vehicle pCDN3 (CTL) or DN-JNK for 24 h before 6h-hypoxia treatment. The data are mean ± SEM (n = 3 per group, * p < 0.05 vs. control; # p < 0.05 vs. hypoxia) from three independent experiments.
Figure 4
Figure 4
Immunohistochemistry assay of hypoxia-treated HL-1 cells. The HL-1 cells were pre-treated with inhibitors SP600125 (10−5 M) or DMSO as a vehicle for 30 min, treated with hypoxia stress (1% O2) for 6 h, fixed and subjected to immunostaining with anti-COL1A (Panel A) and anti-COL3A antibody (Panel B). Quantification of the number of pixels with intracellular label was determined digitally from the fluorescence microscopic images. All indicated fibrotic marker protein densities were significantly reduced in all the cells pre-treated with SP600125 compared to those treated by hypoxia only. Values are the arithmetic means of at least three independent experiments and change to the numbers of pixels are expressed as percent increase or decrease compared to the control level (DMSO only). The percentage of fluorescing cells was calculated per condition as described in Methods. The scale bar corresponds to 50 µM. The data are mean ± SEM (n > 100, * p < 0.01 vs. control; # p < 0.05 vs. hypoxia).
Figure 5
Figure 5
Analysis of nuclear fraction from hypoxia-treated HL-1 cardiomyocytes that modulated by JNK transduction pathway. Panel A: Nuclear lysates were analyzed by Western blots to determine levels of HIF-1α, p-c-Jun, p-ATF2 in HL-1 cells under the control condition (no treatment), treatment with CoCl2 (10−4 M) for 6 h, or hypoxia (1% O2) for 6 h. The data are mean ± SEM (n = 4 per group, * p < 0.05 vs. control) from four independent experiments. Panel B: Representative Western blots and levels of HIF-1α, p-c-Jun, p-ATF2 in the nuclear lysate of HL-1 cells pre-treated with SP600125 (10−5 M) or DMSO as a vehicle for 30 min, then treated with hypoxia stress (1% O2) for 6 h. The bar graph shows the value of each sample relative to that of control cells under normoxia (vehicle only) or hypoxic condition. The data are mean ± SEM (n = 3 per group, * p < 0.05 vs. control; # p < 0.05 vs. hypoxia) from three independent experiments.
Figure 6
Figure 6
Reactive oxygen species (ROS) module hypoxia-induced HIF-1α, JNK signal pathway and fibrosis-related proteins expression in HL-1 cells. Panel A: The ROS levels were assessed with dichlorofluorescin diacetate (DCFH-DA) in HL-1 cells that were pre-incubated with NAC (2 mM) or vehicle only (CTL) for 2 h, then subjected to normoxia (5% CO2 and 95% air) or hypoxia (1% O2) stimulation for 6 h. The bar graph shows the value of each sample relative to that of control cells under normoxic (vehicle only) or hypoxic conditions. The data are mean ± SEM (n = 4 per group, * p < 0.05 vs. control; # p < 0.05 vs. hypoxia) from four independent experiments. Panel B and C: Representative Western blots and levels of fibrosis-related proteins (COL1A, COL3A, TGF-β1, α-SMA), JNK, phosphorylated JNK and MKK4 for whole cell lysate in HL-1 cells pre-treated with or without NAC (2 mM) for 2 h, then treated under hypoxic (1% O2) or normoxic conditions for 6 h. The data are mean ± SEM (* p < 0.05 vs. control; # p < 0.05 vs. hypoxia) from at least three independent experiments. Panel D: Representative Western blots and levels of HIF-1α, fibrosis-related proteins (COL1A, COL3A, TGF-β1, α-SMA) in nuclear lysates of HL-1 cells pre-treated with or without NAC (2 mM) for 2 h, then treated under hypoxic stress (1% O2) or normoxic conditions for 6 h. The bar graph shows the value of each sample relative to that of control cells under normoxic (vehicle only) or hypoxic conditions. The data are mean ± SEM (* p < 0.05 vs. control; # p < 0.05 vs. hypoxia) from at least three independent experiments.
Figure 6
Figure 6
Reactive oxygen species (ROS) module hypoxia-induced HIF-1α, JNK signal pathway and fibrosis-related proteins expression in HL-1 cells. Panel A: The ROS levels were assessed with dichlorofluorescin diacetate (DCFH-DA) in HL-1 cells that were pre-incubated with NAC (2 mM) or vehicle only (CTL) for 2 h, then subjected to normoxia (5% CO2 and 95% air) or hypoxia (1% O2) stimulation for 6 h. The bar graph shows the value of each sample relative to that of control cells under normoxic (vehicle only) or hypoxic conditions. The data are mean ± SEM (n = 4 per group, * p < 0.05 vs. control; # p < 0.05 vs. hypoxia) from four independent experiments. Panel B and C: Representative Western blots and levels of fibrosis-related proteins (COL1A, COL3A, TGF-β1, α-SMA), JNK, phosphorylated JNK and MKK4 for whole cell lysate in HL-1 cells pre-treated with or without NAC (2 mM) for 2 h, then treated under hypoxic (1% O2) or normoxic conditions for 6 h. The data are mean ± SEM (* p < 0.05 vs. control; # p < 0.05 vs. hypoxia) from at least three independent experiments. Panel D: Representative Western blots and levels of HIF-1α, fibrosis-related proteins (COL1A, COL3A, TGF-β1, α-SMA) in nuclear lysates of HL-1 cells pre-treated with or without NAC (2 mM) for 2 h, then treated under hypoxic stress (1% O2) or normoxic conditions for 6 h. The bar graph shows the value of each sample relative to that of control cells under normoxic (vehicle only) or hypoxic conditions. The data are mean ± SEM (* p < 0.05 vs. control; # p < 0.05 vs. hypoxia) from at least three independent experiments.
Figure 7
Figure 7
Schematic diagram of hypoxia promoting atrial fibrosis via the ROS/JNK pathway and downstream activation of nuclear c-Jun/ATF2 phosphorylation to up-regulate the expression of fibrosis-related proteins in HL-1 cells.

References

    1. Burstein B., Nattel S. Atrial Fibrosis: Mechanisms and Clinical Relevance in Atrial Fibrillation. J. Am. Coll. Cardiol. 2008;51:802–809. doi: 10.1016/j.jacc.2007.09.064. - DOI - PubMed
    1. Hu C.P., Dandapat A., Liu Y., Hermonat P.L., Mehta J.L. Blockade of hypoxia-reoxygenation-mediated collagen type I expression and MMP activity by overexpression of TGF-beta1 delivered by AAV in mouse cardiomyocytes. Am. J. Physiol. Heart Circ. Physiol. 2007;293:H1833–H1838. doi: 10.1152/ajpheart.00488.2007. - DOI - PubMed
    1. Nishida K., Qi X.Y., Michael G., Talajic M., Nattel S., Wakili R., Comtois P., Chartier D., Harada M., Iwasaki Y.-K., et al. Mechanisms of Atrial Tachyarrhythmias Associated With Coronary Artery Occlusion in a Chronic Canine Model. Circulation. 2011;123:137–146. doi: 10.1161/CIRCULATIONAHA.110.972778. - DOI - PubMed
    1. Tamamori M., Ito H., Hiroe M., Marumo F., Hata R. Stimulation of collagen synthesis in rat cardiac fibroblasts by exposure to hypoxic culture conditions and suppression of the effect by natriuretic peptides. Cell Biol. Int. 1997;21:175–180. doi: 10.1006/cbir.1997.0130. - DOI - PubMed
    1. Semenza G.L. O2-regulated gene expression: Transcriptional control of cardiorespiratory physiology by HIF-1. J. Appl. Physiol. 2004;96:1173–1177. doi: 10.1152/japplphysiol.00770.2003. - DOI - PubMed

Substances

LinkOut - more resources