. 2021 Mar 23;21(6):2241.
doi: 10.3390/s21062241.

Energy-Efficient Ultrasonic Water Level Detection System with Dual-Target Monitoring

Affiliations

Energy-Efficient Ultrasonic Water Level Detection System with Dual-Target Monitoring

Sanggoo Kang et al. Sensors (Basel). .

Abstract

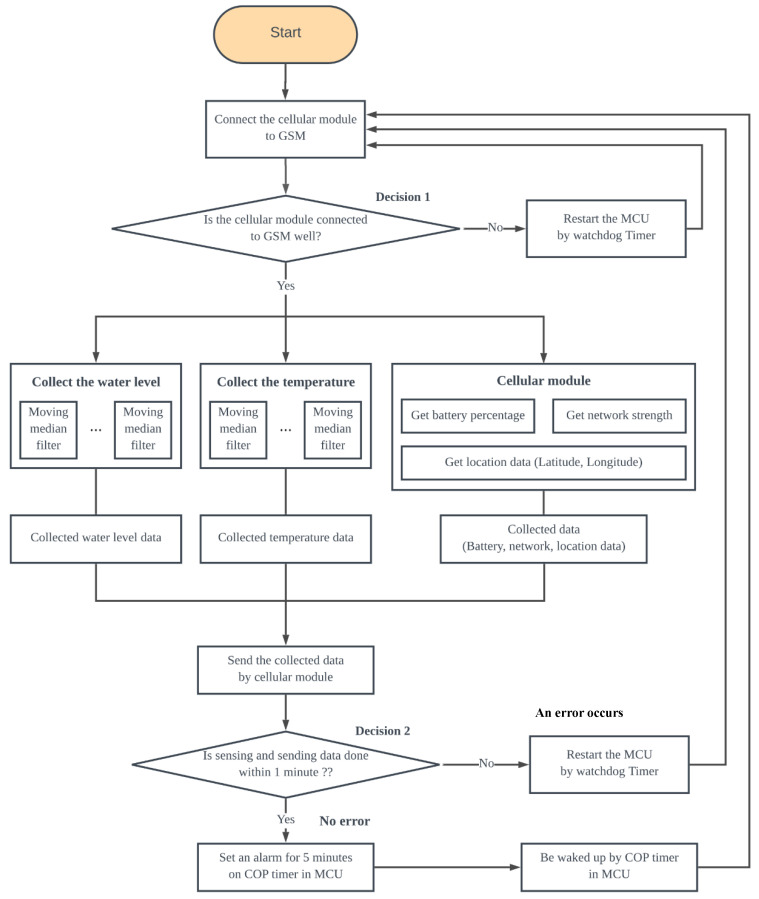
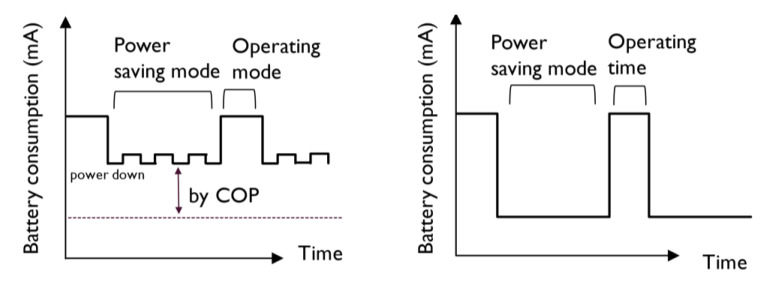
This study presents a developed ultrasonic water level detection (UWLD) system with an energy-efficient design and dual-target monitoring. The water level monitoring system with a non-contact sensor is one of the suitable methods since it is not directly exposed to water. In addition, a web-based monitoring system using a cloud computing platform is a well-known technique to provide real-time water level monitoring. However, the long-term stable operation of remotely communicating units is an issue for real-time water level monitoring. Therefore, this paper proposes a UWLD unit using a low-power consumption design for renewable energy harvesting (e.g., solar) by controlling the unit with dual microcontrollers (MCUs) to improve the energy efficiency of the system. In addition, dual targeting to the pavement and streamside is uniquely designed to monitor both the urban inundation and stream overflow. The real-time water level monitoring data obtained from the proposed UWLD system is analyzed with water level changing rate (WLCR) and water level index. The quantified WLCR and water level index with various sampling rates present a different sensitivity to heavy rain.

Keywords: cloud-based computing platform; dual microcontroller; dual targeting; renewable energy; ultrasonic water level detection; water level changing rate.


Conflict of interest statement

The authors declare no conflict of interest.

Figures

Figure 1
Figure 1
System representation of the basic UWLD system: real-time user interface platform plotting real-time temperature and water level (left) and UWLD-1 unit representation (right). It implies the data from the remote UWLD unit can be monitored in real-time on the website.
Figure 2
Figure 2
Flowchart of basic low-cost UWLD system with a single MCU and an ultrasonic sensor.
Figure 3
Figure 3
Flow chart (Programming layout) of the data processing of the UWLD system.
Figure 4
Figure 4
Installation of UWLD-2 system to monitor the water level on (left) the pavement side and streamside and (right) the streamside.
Figure 5
Figure 5
System representation of UWLD-2 with dual-target sensing. The additional ultrasonic sensor is deployed for monitoring the pavement side water level. The moving median filtered distance data from the pavement side sensor is also transferred to the cloud server.
Figure 6
Figure 6
Battery consumption of operating mode and power-saving mode. The UWLD system with sleep mode by the COP timer (left) and an ideal power-saving mode (right).
Figure 7
Figure 7
System representation of UWLD-3 system with dual-target sensing and dual MCUs.
Figure 8
Figure 8
Flowchart of the UWLD system with dual-target sensing and dual MCUs (UWLD-3).
Figure 9
Figure 9
Installed units and locations: Node 1 (left), Node 2 (middle), and location map of two nodes (right).
Figure 10
Figure 10
Ultrasonic sensor calibration test (left) and measured data (right).
Figure 11
Figure 11
Thirty-six h monitoring of battery percentage record of the UWLD system with the single-MCU system (UWLD-1) in black and dual-MCU system (UWLD-3) in red under similar sunlight conditions. A, B, and C regions indicate battery consumption at the nighttime and daytime and battery replacement time (battery replacement is for only UWLD-1 unit). The result implies the dual-MCU system improves the energy efficiency of the UWLD unit without changing the battery for longer operation period.
Figure 12
Figure 12
Battery consumption by components under the operating and power-saving mode in the single MCU system (UWLD-1). The results imply most of the battery power is consumed by MCU operation in both operating mode and power-saving mode.
Figure 13
Figure 13
Power consumption of single-MCU and dual-MCU system, presenting the energy efficiency improvement with the dual-MCU system in both operating mode and power-saving mode. A 30% and 70% improved energy efficiency is shown under the operating mode and power-saving mode, respectively.
Figure 14
Figure 14
Map of the water level monitoring locations by NOAA and UWLD system. Lake Arlington is the closest gauge location, which is operated by NOAA, located in north Texas.
Figure 15
Figure 15
Water level changes measured by Node 1 streamside and Lake Arlington NOAA for 7 days (15–21 March 2020).
Figure 16
Figure 16
Monitored data in three rainfall events from Node 1 and 2 streamside compared with dry day’s reference water level in yellow.
Figure 17
Figure 17
Pavement-side water level changes on 6 July Node 1 (left) and Node 2 (right).
Figure 18
Figure 18
WLCR of 5 days rainfall (14–18 March): (top) water level change, (middle) WLCR by the 5-min sampling rate, and (bottom) WLCR by the 1-h sampling rate. The three graphs showing the WLCR by the 5-min sampling rate show the more sensitive behavior at the higher WLCR case than the 1-h sampling rate.
Figure 19
Figure 19
Normalized maximum water level, WLCR, and area data with the 16 rainfall events are presented. The results indicate a similar tendency by the rainfall events.
Figure 20
Figure 20
Water level and WLI changes; (top) water level change and 4 different WLI curves based on 0.5-, 1-, 2-, and 3-h time windows; (middle) the zoomed-in plot of the E1 rainfall event, region A of the top figure; and (bottom) zoomed-in plot of the E4 rainfall event, region B of the top figure. The WLIs calculated by different time windows show the more sensitive change in the rapid water level change case (B region) than the relatively moderate water level change case (A region).

References

    1. Lo S.W., Wu J.H., Lin F.P., Hsu C.H. Cyber surveillance for flood disasters. Sensors. 2015;15:2369–2387. doi: 10.3390/s150202369. - DOI - PMC - PubMed
    1. Woodworth P.L., Smith D.E. A one year comparison of radar and bubbler tide gauges at Liverpool. Int. Hydrogr. Rev. 2003;4:42–49.
    1. Euliss N.H., Mushet D.M. Water-level fluctuation in wetlands as a function of landscape condition in the prairie pothole region. Wetlands. 1996;16:587–593. doi: 10.1007/BF03161350. - DOI
    1. Zheng G., Zong H. High accuracy surface perceiving water level gauge with self calibration; Proceedings of the 2009 International Conference on Mechatronics and Automation; Changchun, China. 9–12 August 2009; pp. 3680–3686.
    1. Bartos M., Wong B., Kerkez B. Open storm: A complete framework for sensing and control of urban watersheds. Environ. Sci. Water Res. Technol. 2018;4:346–358. doi: 10.1039/C7EW00374A. - DOI

LinkOut - more resources