Randomized Controlled Trial
. 2021 Mar 23;13(3):1042.
doi: 10.3390/nu13031042.

The Effects of Time-Restricted Eating versus Standard Dietary Advice on Weight, Metabolic Health and the Consumption of Processed Food: A Pragmatic Randomised Controlled Trial in Community-Based Adults

Affiliations
Randomized Controlled Trial

The Effects of Time-Restricted Eating versus Standard Dietary Advice on Weight, Metabolic Health and the Consumption of Processed Food: A Pragmatic Randomised Controlled Trial in Community-Based Adults

Nicholas Edward Phillips et al. Nutrients. .

Abstract

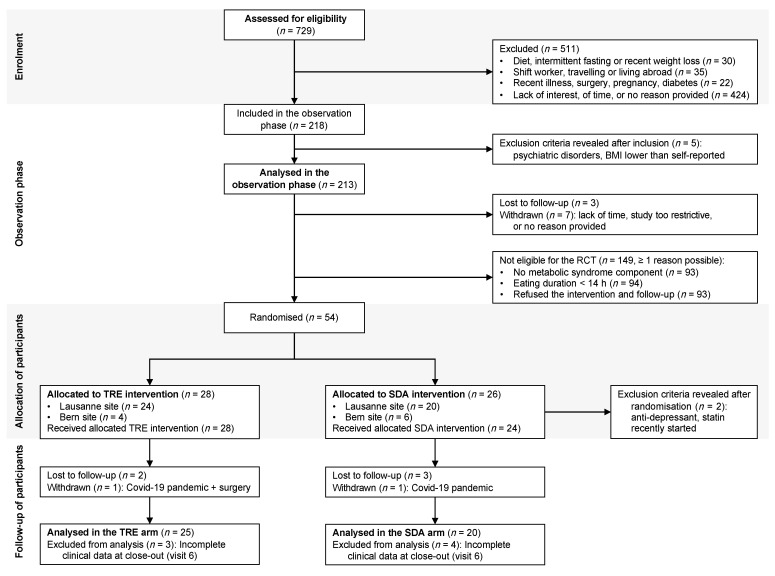
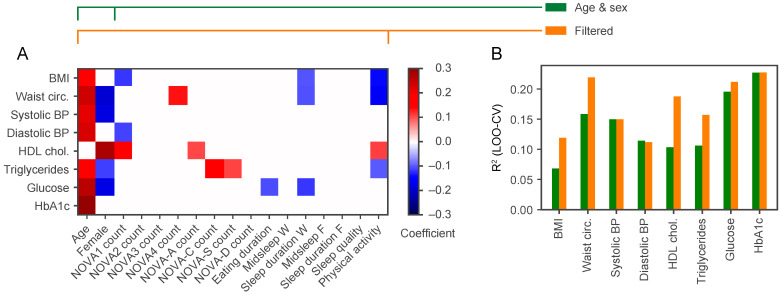
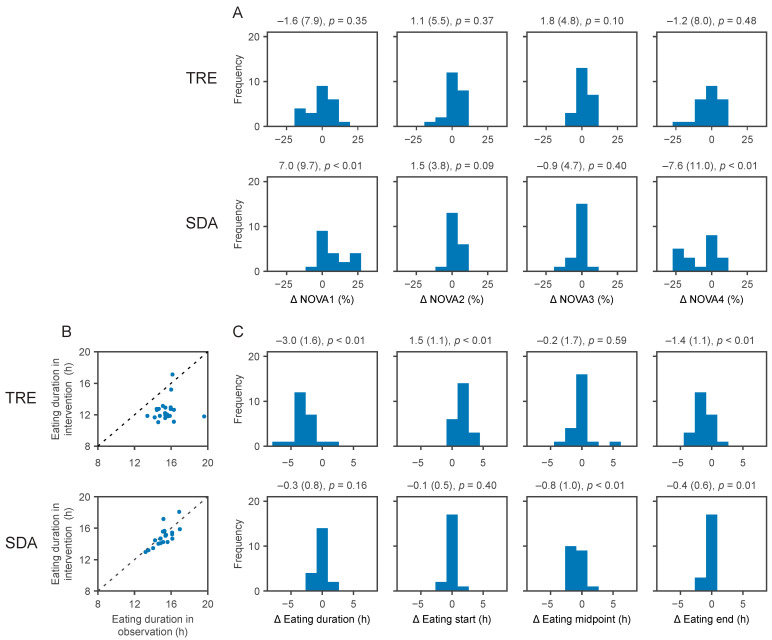
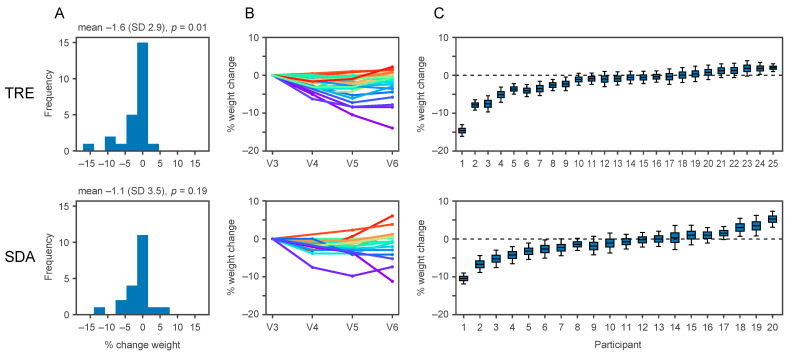
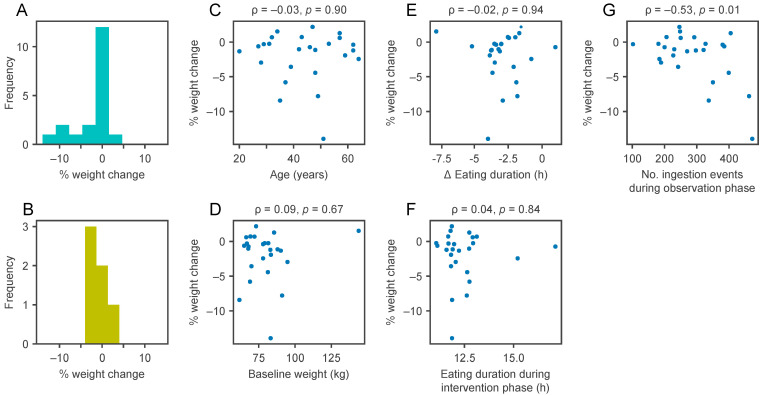
Weight loss is key to controlling the increasing prevalence of metabolic syndrome (MS) and its components, i.e., central obesity, hypertension, prediabetes and dyslipidaemia. The goals of our study were two-fold. First, we characterised the relationships between eating duration, unprocessed and processed food consumption and metabolic health. During 4 weeks of observation, 213 adults used a smartphone application to record food and drink consumption, which was annotated for food processing levels following the NOVA classification. Low consumption of unprocessed food and low physical activity showed significant associations with multiple MS components. Second, in a pragmatic randomised controlled trial, we compared the metabolic benefits of 12 h time-restricted eating (TRE) to standard dietary advice (SDA) in 54 adults with an eating duration > 14 h and at least one MS component. After 6 months, those randomised to TRE lost 1.6% of initial body weight (SD 2.9, p = 0.01), compared to the absence of weight loss with SDA (-1.1%, SD 3.5, p = 0.19). There was no significant difference in weight loss between TRE and SDA (between-group difference -0.88%, 95% confidence interval -3.1 to 1.3, p = 0.43). Our results show the potential of smartphone records to predict metabolic health and highlight that further research is needed to improve individual responses to TRE such as a shorter eating window or its actual clock time.

Keywords: NOVA classification; dietary advice; eating pattern; metabolic syndrome; processed food; time-restricted eating; weight loss.


Conflict of interest statement

The authors have no potential conflict of interest to declare. The funders had no role in the design of the study; in the collection, analyses, or interpretation of data; in the writing of the manuscript, or in the decision to publish the results.

Figures

Figure 1
Figure 1
Flow of participants. Adapted from Reference [39]. Out of the 729 adults screened for eligibility, 213 were analysed in the observation phase and 54 were randomised to 12 h time-restricted eating (TRE) versus standard dietary advice (SDA). During the intervention phase, two participants had to be excluded the day after randomisation (see text), five were lost to follow up and two withdrew from the study (due to the Covid-19 pandemic or other reasons). The main analyses therefore comprised 25 participants in the TRE arm and 20 participants in the SDA arm.
Figure 2
Figure 2
The addition of NOVA categories and physical activity to age and sex increases the predictive power for MS components. (A) Each row shows the regression coefficients for predicting the clinical variable (labelled on the y-axis) using the explanatory variables (labelled on the x-axis), all measured in the observation phase. BMI, body mass index; BP, blood pressure; HbA1c, glycated haemoglobin; HDL chol., high-density lipoprotein cholesterol; NOVA count, the number of ingestion events of each NOVA category; NOVA-A, alcohol-containing drinks; NOVA-C, caffeinated drinks; NOVA-S, sweet drinks; NOVA-D, other drinks; Midsleep W and Midsleep F, the midpoint of sleep on workdays and free days, respectively; Sleep duration W and Sleep duration F, the sleep duration on workdays and free days, respectively; Waist circ., waist circumference. The regression coefficients show the mean posterior parameter estimate, and variables that are not significant are shown as white space. The red colour corresponds to a positive coefficient, and the blue colour a negative coefficient. (B) Bar heights represent the R2 values calculated on test participants using leave-one-out cross-validation (LOO-CV) to compare the predictive performance of a model that uses only age and sex (green bars) versus a model that uses all variables that were significant (orange bars, selected variables in panel (A)).
Figure 3
Figure 3
Changes in the consumption of NOVA categories and in eating duration with the TRE and SDA interventions. During the 6 month intervention phase, the changes in consumption of NOVA categories (panel (A)) and in eating duration (panels (B,C)) showed compliance with time-restricted eating (TRE) and standard dietary advice (SDA) interventions. Numbers above each histogram represent the changes (unit on the x-axis) as mean (standard deviation) and p-value. (A) From left to right: Changes (x-axis) in the proportion of unprocessed or minimally processed foods (NOVA1), processed culinary ingredients (NOVA2), processed foods (NOVA3), and ultra-processed foods (NOVA4), depicted as % of all classified ingestion events and the number of participants per bin is shown on the y-axis. (B) Scatter plot of eating duration during the observation and the intervention phases with TRE (top) and SDA (bottom). The dashed line represents an absence of change in eating duration between both study phases. (C) From left to right: Changes (x-axis) in eating duration, the start of the eating interval, the midpoint (median) of the eating interval, and the end of the eating interval compared to the observation phase, in fractional hours (i.e., 1.33 h = 1 h and 20 min). A shift to the left means a shorter eating duration, an earlier start, an earlier midpoint, and an earlier end of the eating interval, respectively. A shift to the right means a longer eating duration, a later start, a later midpoint, and a later end of the eating interval, respectively.
Figure 4
Figure 4
TRE alters body weight. (A) Change in body weight after time-restricted eating (TRE, top) compared to standard dietary advice (SDA, bottom). Data are presented as histograms of weight change (in % of initial body weight). Numbers above the histograms represent the weight change as mean (standard deviation) and p-value. (B) Recorded weight measurements for each participant across multiple visits expressed as a percentage change relative to initial body weight. V3, randomisation visit; V4, interim visit 2 months post-randomisation; V5, interim visit 4 months post-randomisation; V6, closeout visit. (C) For each individual (x-axis), the weight change (in % of initial body weight) was estimated using all recorded weight measurements and a quadratic regression model. The boxes show the 25th, 50th, and 75th percentiles of estimated weight change, and the whiskers show the 5th and 95th percentiles.
Figure 5
Figure 5
The number of items recorded in the observation phase correlates with weight loss. Exploration of potential explanatory parameters for more weight loss in the time-restricted eating (TRE) group: Subgroup analysis by sex (panel (A): women; panel (B): men, p-value for comparison = 0.57); panel (C): weight change relative to age; panel (D): weight at baseline; panel (E): eating duration change between study phases; panel (F): eating duration during the intervention phase; panel (G): the number of ingestion events recorded during the observation phase (after pre-processing of data as detailed in Section 2.3). Numbers above the scatter plots represent the Pearson correlation coefficient (Greek letter ρ) and the p-value.

References

    1. Saklayen M.G. The Global Epidemic of the Metabolic Syndrome. Curr. Hypertens. Rep. 2018;20:12. doi: 10.1007/s11906-018-0812-z. - DOI - PMC - PubMed
    1. Alberti K.G.M.M., Eckel R.H., Grundy S.M., Zimmet P.Z., Cleeman J.I., Donato K.A., Fruchart J.-C., James W.P.T., Loria C.M., Smith S.C., et al. Harmonizing the Metabolic Syndrome: A Joint Interim Statement of the International Diabetes Federation Task Force on Epidemiology and Prevention; National Heart, Lung, and Blood Institute; American Heart Association; World Heart Federation; International Atherosclerosis Society; and International Association for the Study of Obesity. Circulation. 2009;120:1640–1645. doi: 10.1161/circulationaha.109.192644. - DOI - PubMed
    1. Butler J., Rodondi N., Zhu Y., Figaro K., Fazio S., Vaughan D.E., Satterfield S., Newman A.B., Goodpaster B., Bauer D.C., et al. Metabolic Syndrome and the Risk of Cardiovascular Disease in Older Adults. J. Am. Coll. Cardiol. 2006;47:1595–1602. doi: 10.1016/j.jacc.2005.12.046. - DOI - PubMed
    1. Bray G.A., Frühbeck G., Ryan D.H., Wilding J.P.H. Management of obesity. Lancet. 2016;387:1947–1956. doi: 10.1016/S0140-6736(16)00271-3. - DOI - PubMed
    1. Khera R., Murad M.H., Chandar A.K., Dulai P.S., Wang Z., Prokop L.J., Loomba R., Camilleri M., Singh S. Association of Pharmacological Treatments for Obesity With Weight Loss and Adverse Events: A Systematic Review and Meta-Analysis. JAMA. 2016;315:2424–2434. doi: 10.1001/jama.2016.7602. - DOI - PMC - PubMed

Publication types