

Shikonin Derivatives from Onsoma visianii Decrease Expression of Phosphorylated STAT3 in Leukemia Cells and Exert Antitumor Activity
- PMID: 33807148
- PMCID: PMC8065735
- DOI: 10.3390/nu13041147
Shikonin Derivatives from Onsoma visianii Decrease Expression of Phosphorylated STAT3 in Leukemia Cells and Exert Antitumor Activity
Abstract
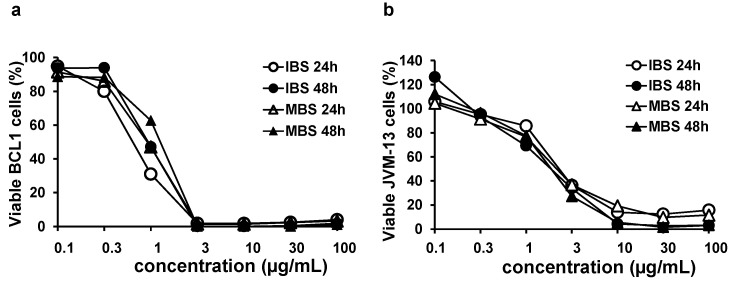
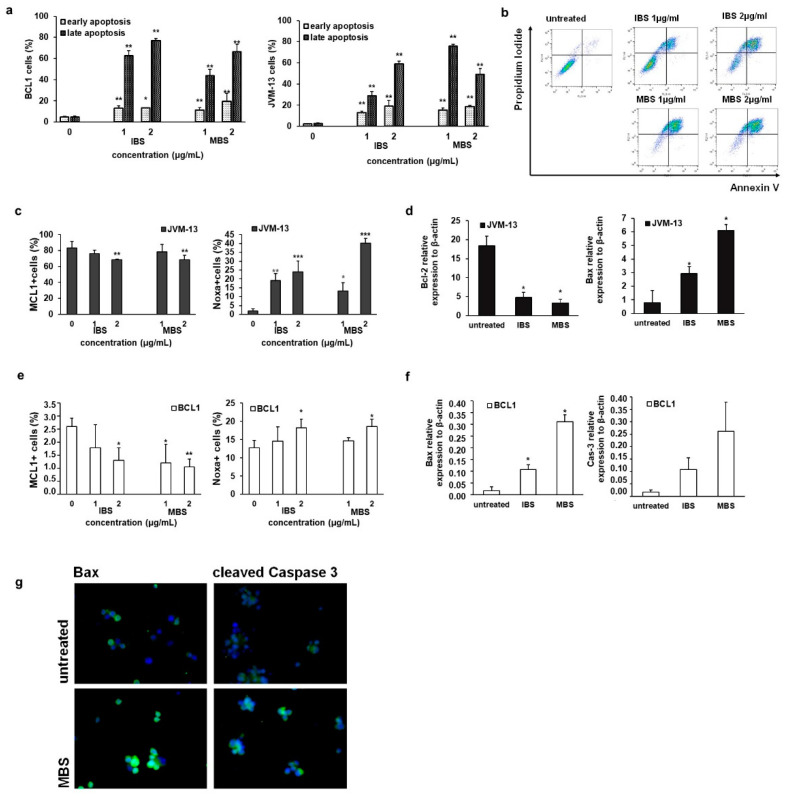
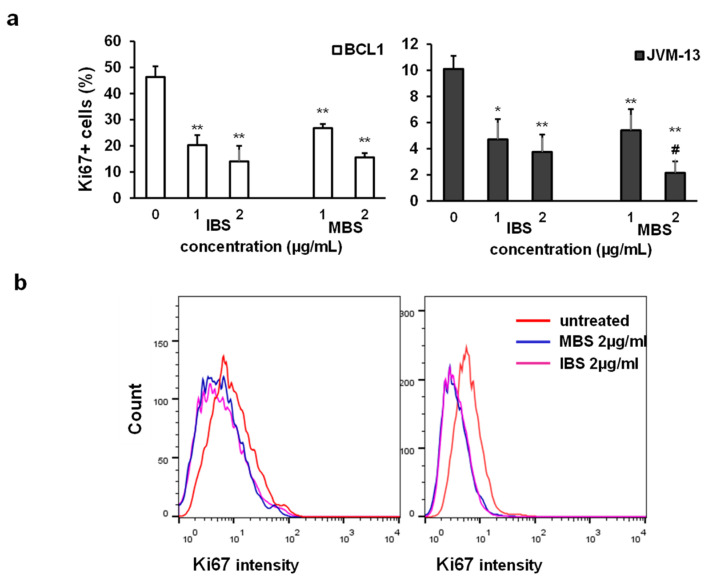
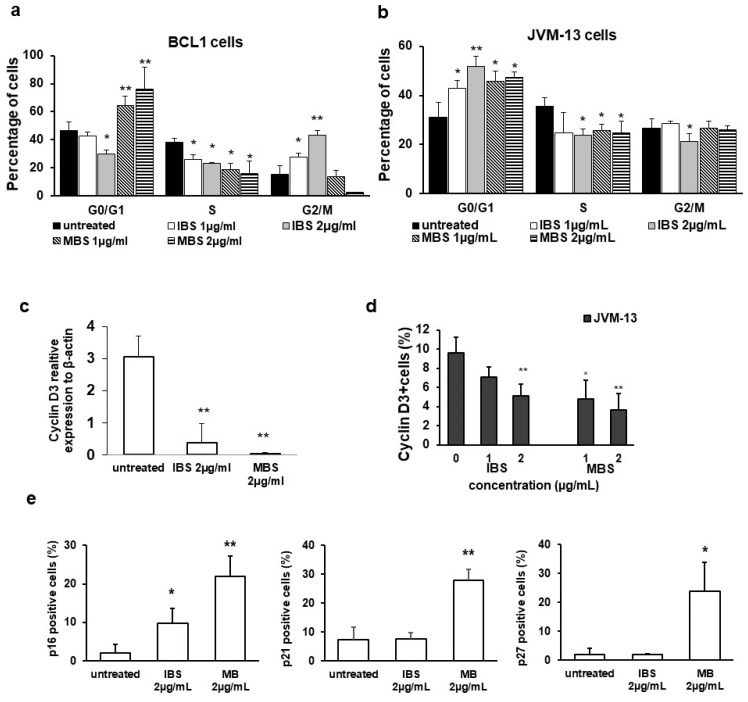
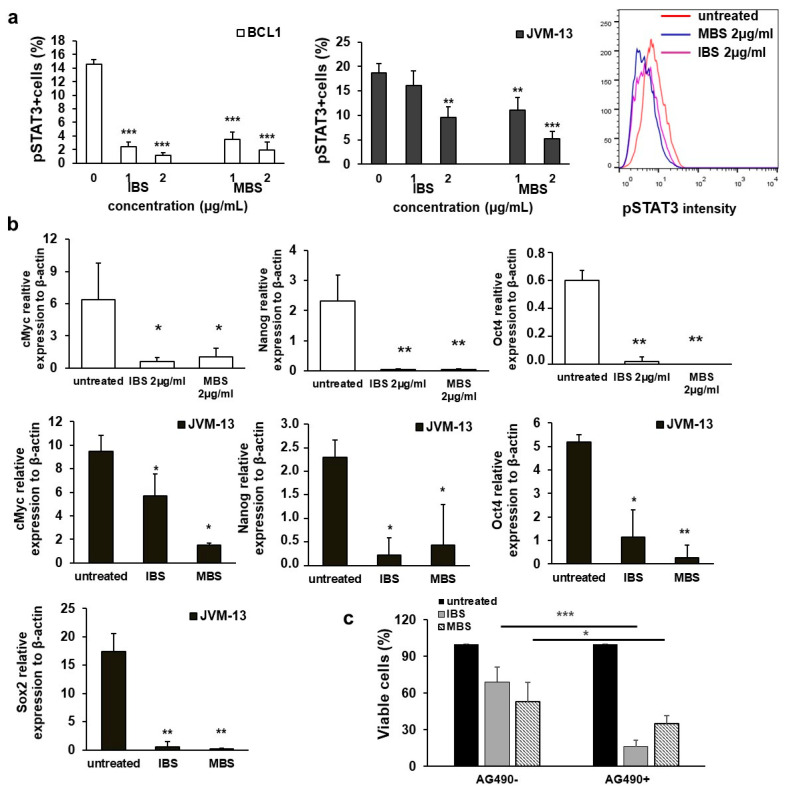
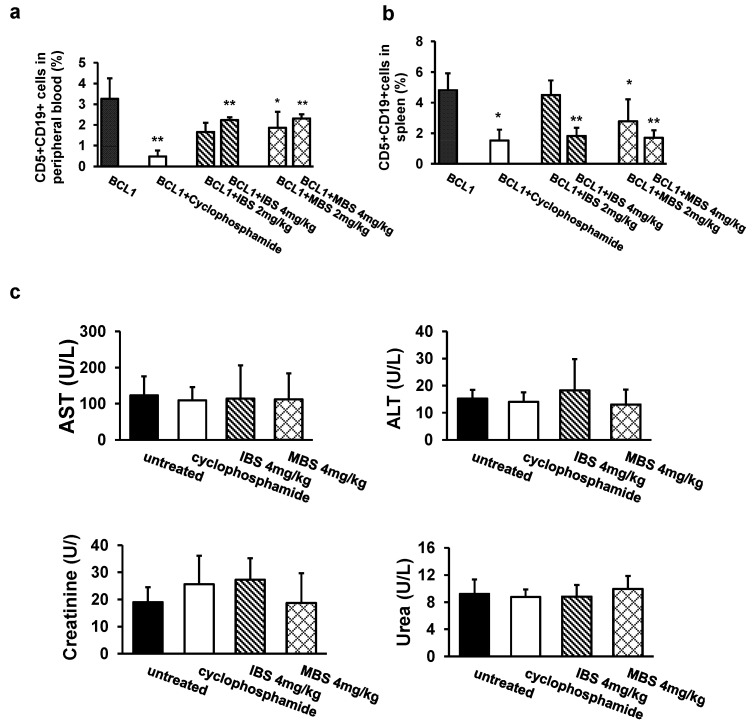
Antitumor effects of shikonins on chronic lymphocytic leukemia (CLL) and B-cell prolymphocytic leukemia (B-PLL) are mostly unexplored. The antitumor activity of shikonins, isolated from Onosma visianii Clem (Boraginaceae), in BCL1, mouse CLL cells and JVM-13, human B-PLL cells was explored in this study. The cytotoxicity of shikonin derivatives was measured by an MTT test. Cell death, proliferation, cell cycle, and expression of molecules that control these processes were analyzed by flow cytometry. Expression of STAT3-regulated genes was analyzed by real-time q-RT-PCR (Quantitative Real-Time Polymerase Chain Reaction). The antitumor effects of shikonin derivatives in vivo were analyzed, using flow cytometry, by detection of leukemia cells in the peripheral blood and spleens of mice intravenously injected with BCL1 cells. The two most potent derivatives, isobutyrylshikonin (IBS) and α-methylbutyrylshikonin (MBS), induced cell cycle disturbances and apoptosis, inhibited proliferation, and decreased expression of phospho-STAT3 and downstream-regulated molecules in BCL1 and JVM-13 cells. IBS and MBS decreased the percentage of leukemia cells in vivo. The link between the decrease in phosphorylated STAT3 by MBS and IBS and BCL1 cell death was confirmed by detection of enhanced cell death after addition of AG490, an inhibitor of Jak2 kinase. It seems that IBS and MBS, by decreasing STAT3 phosphorylation, trigger apoptosis, inhibit cell proliferation, and attenuate leukemia cell stemness.
Keywords: BCL1; JVM-13; Onosma visianii; STAT3; isobutyrylshikonin; α-methylbutyrylshikonin.
Conflict of interest statement
The authors declare no conflict of interest.
Figures
Similar articles
-
Naphthoquinone rich Onosma visianii Clem (Boraginaceae) root extracts induce apoptosis and cell cycle arrest in HCT-116 and MDA-MB-231 cancer cell lines.Nat Prod Res. 2018 Nov;32(22):2712-2716. doi: 10.1080/14786419.2017.1374271. Epub 2017 Sep 7. Nat Prod Res. 2018. PMID: 28882053
-
Deoxyshikonin isolated from Arnebia euchroma inhibits colorectal cancer by down-regulating the PI3K/Akt/mTOR pathway.Pharm Biol. 2019 Dec;57(1):412-423. doi: 10.1080/13880209.2019.1626447. Pharm Biol. 2019. PMID: 31230505 Free PMC article.
-
Naphthoquinones from Onosma paniculata induce cell-cycle arrest and apoptosis in melanoma Cells.J Nat Prod. 2012 May 25;75(5):865-9. doi: 10.1021/np2006499. Epub 2012 Apr 24. J Nat Prod. 2012. PMID: 22530779 Free PMC article.
-
The Pt(S-pr-thiosal)2 and BCL1 Leukemia Lymphoma: Antitumor Activity In Vitro and In Vivo.Int J Mol Sci. 2022 Jul 24;23(15):8161. doi: 10.3390/ijms23158161. Int J Mol Sci. 2022. PMID: 35897737 Free PMC article.
-
Inhibition of c-MYC with involvement of ERK/JNK/MAPK and AKT pathways as a novel mechanism for shikonin and its derivatives in killing leukemia cells.Oncotarget. 2015 Nov 17;6(36):38934-51. doi: 10.18632/oncotarget.5380. Oncotarget. 2015. PMID: 26472107 Free PMC article.
Cited by
-
Shikonin Exerts an Antileukemia Effect against FLT3-ITD Mutated Acute Myeloid Leukemia Cells via Targeting FLT3 and Its Downstream Pathways.Acta Haematol. 2024;147(3):310-324. doi: 10.1159/000534101. Epub 2023 Nov 3. Acta Haematol. 2024. PMID: 37926079 Free PMC article.
-
Specific signaling pathways mediated programmed cell death in tumor microenvironment and target therapies.Discov Oncol. 2025 May 16;16(1):776. doi: 10.1007/s12672-025-02592-2. Discov Oncol. 2025. PMID: 40377777 Free PMC article. Review.
-
Onosma L. as a source of anticancer agents: phytochemistry to mechanistic insight.Explor Target Antitumor Ther. 2022;3(5):719-733. doi: 10.37349/etat.2022.00109. Epub 2022 Oct 31. Explor Target Antitumor Ther. 2022. PMID: 36338520 Free PMC article. Review.
-
The anti-leukemia activity and mechanisms of shikonin: a mini review.Front Pharmacol. 2023 Nov 2;14:1271252. doi: 10.3389/fphar.2023.1271252. eCollection 2023. Front Pharmacol. 2023. PMID: 38026987 Free PMC article. Review.
References
-
- Wiench B., Chen Y.R., Paulsen M., Hamm R., Schröder S., Yang N.S., Efferth T. Integration of Different “-omics” Technologies Identifies Inhibition of the IGF1R-Akt-mTOR Signaling Cascade Involved in the Cytotoxic Effect of Shikonin against Leukemia Cells. Evid. Based Complementary Altern. Med. 2013;2013:818709. doi: 10.1155/2013/818709. - DOI - PMC - PubMed
-
- Hazan-Halevy I., Harris D., Liu Z., Liu J., Li P., Chen X., Shanker S., Ferrajoli A., Keating M.J., Estrov Z. STAT3 is constitutively phosphorylated on serine 727 residues, binds DNA, and activates transcription in CLL cells. Blood. 2010;115:2852–2863. doi: 10.1182/blood-2009-10-230060. - DOI - PMC - PubMed
MeSH terms
Substances
LinkOut - more resources
Full Text Sources
Other Literature Sources
Medical
Research Materials
Miscellaneous
