

Metagenomic Analysis of the Respiratory Microbiome of a Broiler Flock from Hatching to Processing
- PMID: 33807233
- PMCID: PMC8065701
- DOI: 10.3390/microorganisms9040721
Metagenomic Analysis of the Respiratory Microbiome of a Broiler Flock from Hatching to Processing
Abstract
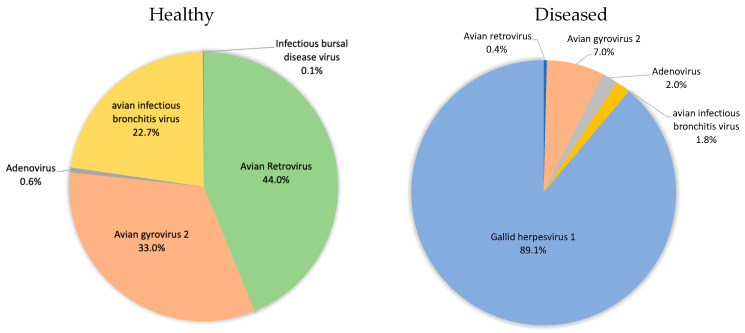
Elucidating the complex microbial interactions in biological environments requires the identification and characterization of not only the bacterial component but also the eukaryotic viruses, bacteriophage, and fungi. In a proof of concept experiment, next generation sequencing approaches, accompanied by the development of novel computational and bioinformatics tools, were utilized to examine the evolution of the microbial ecology of the avian trachea during the growth of a healthy commercial broiler flock. The flock was sampled weekly, beginning at placement and concluding at 49 days, the day before processing. Metagenomic sequencing of DNA and RNA was utilized to examine the bacteria, virus, bacteriophage, and fungal components during flock growth. The utility of using a metagenomic approach to study the avian respiratory virome was confirmed by detecting the dysbiosis in the avian respiratory virome of broiler chickens diagnosed with infection with infectious laryngotracheitis virus. This study provides the first comprehensive analysis of the ecology of the avian respiratory microbiome and demonstrates the feasibility for the use of this approach in future investigations of avian respiratory diseases.
Keywords: avian; bioinformatics; chicken; microbiome; respiratory; virome.
Conflict of interest statement
The authors declare no conflict of interest. The funders had no role in the design of the study; in the collection, analyses, or interpretation of data; in the writing of the manuscript. Or in the decision to publish the results.
Figures
Similar articles
-
The tracheal virome of broiler chickens with respiratory disease complex in Iran: the metagenomics study.Iran J Microbiol. 2021 Jun;13(3):337-344. doi: 10.18502/ijm.v13i3.6396. Iran J Microbiol. 2021. PMID: 34540172 Free PMC article.
-
A Consistent and Predictable Commercial Broiler Chicken Bacterial Microbiota in Antibiotic-Free Production Displays Strong Correlations with Performance.Appl Environ Microbiol. 2018 May 31;84(12):e00362-18. doi: 10.1128/AEM.00362-18. Print 2018 Jun 15. Appl Environ Microbiol. 2018. PMID: 29625981 Free PMC article.
-
ViromeScan: a new tool for metagenomic viral community profiling.BMC Genomics. 2016 Mar 1;17:165. doi: 10.1186/s12864-016-2446-3. BMC Genomics. 2016. PMID: 26932765 Free PMC article.
-
Human Virome and Disease: High-Throughput Sequencing for Virus Discovery, Identification of Phage-Bacteria Dysbiosis and Development of Therapeutic Approaches with Emphasis on the Human Gut.Viruses. 2019 Jul 18;11(7):656. doi: 10.3390/v11070656. Viruses. 2019. PMID: 31323792 Free PMC article. Review.
-
Uncovering the hidden villain within the human respiratory microbiome.Diagnosis (Berl). 2014 Sep 1;1(3):203-212. doi: 10.1515/dx-2014-0039. Diagnosis (Berl). 2014. PMID: 29540002 Review.
Cited by
-
Litter Management Strategies and Their Impact on the Environmental and Respiratory Microbiome Might Influence Health in Poultry.Microorganisms. 2022 Apr 22;10(5):878. doi: 10.3390/microorganisms10050878. Microorganisms. 2022. PMID: 35630323 Free PMC article.
-
Exploring the complexities of poultry respiratory microbiota: colonization, composition, and impact on health.Anim Microbiome. 2024 May 6;6(1):25. doi: 10.1186/s42523-024-00308-5. Anim Microbiome. 2024. PMID: 38711114 Free PMC article. Review.
-
A metagenomic investigation of the faecal RNA virome structure of asymptomatic chickens obtained from a commercial farm in Durban, KwaZulu-Natal province, South Africa.BMC Genomics. 2024 Jun 24;25(1):629. doi: 10.1186/s12864-024-10517-6. BMC Genomics. 2024. PMID: 38914944 Free PMC article.
-
Uncovering the core principles of the gut-lung axis to enhance innate immunity in the chicken.Front Immunol. 2022 Oct 4;13:956670. doi: 10.3389/fimmu.2022.956670. eCollection 2022. Front Immunol. 2022. PMID: 36268022 Free PMC article.
-
Bacterial communities along parrot digestive and respiratory tracts: the effects of sample type, species and time.Int Microbiol. 2024 Feb;27(1):127-142. doi: 10.1007/s10123-023-00372-y. Epub 2023 May 24. Int Microbiol. 2024. PMID: 37222909 Free PMC article.
References
Grants and funding
LinkOut - more resources
Full Text Sources
Other Literature Sources
