. 2021 Mar 31;22(7):3628.
doi: 10.3390/ijms22073628.

High Mobility Group Box 1 Promotes Lung Cancer Cell Migration and Motility via Regulation of Dynamin-Related Protein 1

Affiliations

High Mobility Group Box 1 Promotes Lung Cancer Cell Migration and Motility via Regulation of Dynamin-Related Protein 1

Wei-Lun Liu et al. Int J Mol Sci. .

Abstract

High mobility group box 1 (HMGB1) has been demonstrated to promote the migration and invasion of non-small cell lung cancer (NSCLC). However, the mechanism of action of HMGB1 in regulating tumor mobility remains unclear. Therefore, we aimed to investigate whether HMGB1 affects mitochondria distribution and regulates dynamin-related protein 1 (DRP1)-mediated lamellipodia/filopodia formation to promote NSCLC migration. The regulation of mitochondrial membrane tension, dynamics, polarization, fission process, and cytoskeletal rearrangements in lung cancer cells by HMGB1 was analyzed using confocal microscopy. The HMGB1-mediated regulation of DRP1 phosphorylation and colocalization was determined using immunostaining and co-immunoprecipitation assays. The tumorigenic potential of HMGB1 was assessed in vivo and further confirmed using NSCLC patient samples. Our results showed that HMGB1 increased the polarity and mobility of cells (mainly by regulating the cytoskeletal system actin and microtubule dynamics and distribution), promoted the formation of lamellipodia/filopodia, and enhanced the expression and phosphorylation of DRP1 in both the nucleus and cytoplasm. In addition, HMGB1 and DRP1 expressions were positively correlated and exhibited poor prognosis and survival in patients with lung cancer. Collectively, HMGB1 plays a key role in the formation of lamellipodia and filopodia by regulating cytoskeleton dynamics and DRP1 expression to promote lung cancer migration.

Keywords: cytoskeleton dynamics; dynamin related protein 1; high mobility group box 1; lamellipodia/filopodia; mitochondrial fission; non-small cell lung cancer.


Conflict of interest statement

The authors declare no conflict of interest.

Figures
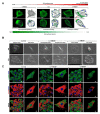
Figure 1
Figure 1
HMGB1 regulates lung cancer cell spreading and polarization through the regulation of microtubule and actin dynamics. (A) A549 cells were transfected with LV-HMGB1 or small interfering (si)-HMGB1 for 48 h, and then they were stained with F-actin and analyzed using confocal microscopy and the Imaris software (red arrows: leading edge; blue arrows: stress fibers. (B) Cell morphology and polarity were examined by SEM analysis. (C) To determine the organization of actin and microtubule cytoskeleton in cellular protrusions and polarities, the cells were stained with F-actin (red color), α-tubulin (green color), and nucleus dye (blue color), and they were analyzed using confocal microscopy and the Imaris software. Data are representative of three independent experiments. HMGB1: high mobility group box 1; si-HMGB1: HMGB1 small interfering RNA; Con: control; LV-HMGB1: lentiviral vector-carrying HMGB1; DAPI: 4′,6-diamidino-2-phenylindole.
Figure 2
Figure 2
Mitochondrial dynamics is regulated by HMGB1. (A) Mitochondria were stained using the mitochondria tracker dye (red color) and nucleus dye (blue color) and analyzed using confocal microscopy and the Imaris software. Mitochondrial shapes (highlighted in white square as an example) were classified as type 1 (small fragmented mitochondria), type 2 (branched, curve, circular, and tubular mitochondria), type 3 (large tubular mitochondria), and type 4 (aggregated and fusion mitochondria). (B,C) A549 cells were transfected with LV-HMGB1 or si-HMGB1, respectively, for 48 h. The types of mitochondrial shapes were classified and quantified using confocal microscopy, the Imaris software, and the Mountains 8 software. (D) TEM analysis was used to confirm mitochondrial shapes (blue arrows: large mitochondria; red arrows: small fragmented mitochondria; green arrows: branched mitochondria).
Figure 3
Figure 3
HMGB1 regulates DRP1 phosphorylation and mediates mitochondrial trafficking from the cortical cytoskeleton to the leading edge to promote cancer migration. (A) A549 cells were transfected with LV-HMGB1 or si-HMGB1 for 48 h. Cells were stained with HMGB1 (green color), phospho-DRP1 (pDRP1) (Ser616) (red color), and nucleus dye (blue color), and they were analyzed using confocal microscopy and the Imaris software. (B,C) Mitochondrial repositioning (mitochondria tracker dye: red color) and F-actin/α-tubulin (green color) expression, respectively, were analyzed using confocal microscopy and the Imaris software. (D) F-actin and G-actin expressions were analyzed by Western blot (WB). (E,F) Cell migration was analyzed using the wound-healing assay (scale bar: 500 μm). Cells were analyzed by time-lapse microscopy. (G) migration distance, (H) mean velocity, and (I) displacement were determined. * p < 0.05 and ** p < 0.01 compared with the control. F: F-actin; G: G-actin.
Figure 4
Figure 4
HMGB1 regulates DRP1 phosphorylation and colocalization. A549 cells were transfected with LV-HMGB1 or si-HMGB1 for 48 h. (A) Cells were stained with HMGB1 (green color), pDRP1 (Ser616) (red color), and nucleus dye (blue color), and they were analyzed using confocal microscopy and the Imaris software. (B,C) To validate that HMGB1 regulates pDRP1 (Ser616) expression, confocal analysis, image construction, and quantification were done using the Imaris software. Data are representative of three independent experiments. (D) HMGB1 colocalization with pDRP1 (Ser616) was determined by co-immunoprecipitation. (E,F) The regulation pathway was examined by a Western blot assay. * p < 0.05 compared with the control. Con: control. CP: cytosolic protein; NP: nucleus protein; IP: immunoprecipitation; IB: immunoblotting; IgG: immunoglobulin G; Lamin A/C: nucleus protein internal control.
Figure 5
Figure 5
HMGB1 promotes tumor growth and pDRP1 (Ser616) expression in vivo. (A) Schematic diagram of the experimental process. Xenograft models were established using severe combined immunodeficiency (SCID) mice that were subcutaneously inoculated with the control or HMGB1-overexpressing (LV-HMGB1) A549 cells (n = 8 mice/group). (B) Fluorescent labeling of cells. (C,D) Fluorescence based on the region of interest and tumor size, respectively, were measured. (EG) Expression of HMGB1 mRNA and protein in tumor tissues was assessed by real-time PCR, Western blotting, and an immunohistochemistry assay, respectively. (HJ) Expression of pDRP1 (Ser616) mRNA and protein in tumor tissues was measured by real-time qPCR, Western blotting, and an immunohistochemistry assay, respectively. * p < 0.05 compared with the control. ROI: region of interest.
Figure 6
Figure 6
Elevated expression of HMGB1 and DNM1L (DRP1) genes is associated with a poor outcome in NSCLC. (A,B) Expression of HMGB1 and pDRP1 (Ser616), respectively, in human normal or tumor tissues was examined by immunohistochemistry (IHC) and WB. * p < 0.01 compared with the control. (C) Effects of HMGB1 and DNM1L expression on overall survival in lung cancer patients were analyzed; the Kaplan–Meier plots were generated using a Kaplan–Meier Plotter obtained from the DriverDBv3 database (NT, TP, and TR) (http://driverdb.tms.cmu.edu.tw/) [30]. (D) Correlations between HMGB1 and DNM1L gene expression and 5-year overall survival rate of patients with lung cancer were obtained using the DriverDBv3 database. (E) Correlations of HMGB1 and DNM1L expression, the Pearson’s correlation, and Kendall’s tau coefficient tests were used to calculate the p value. NSCLC: non-small-cell lung cancer; N: normal lung tissue; T: lung tumor tissue.

Similar articles

Cited by

References

    1. Siegel R.L., Miller K.D., Jemal A. Cancer statistics, 2020. CA Cancer J. Clin. 2020;70:7–30. doi: 10.3322/caac.21590. - DOI - PubMed
    1. Jemal A., Fedewa S.A. Lung Cancer Screening with Low-Dose Computed Tomography in the United States-2010 to 2015. JAMA Oncol. 2017;3:1278–1281. doi: 10.1001/jamaoncol.2016.6416. - DOI - PMC - PubMed
    1. Wu L., Yang L. The function and mechanism of HMGB1 in lung cancer and its potential therapeutic implications. Oncol. Lett. 2018;15:6799–6805. doi: 10.3892/ol.2018.8215. - DOI - PMC - PubMed
    1. Tripathi A., Shrinet K., Kumar A. HMGB1 protein as a novel target for cancer. Toxicol. Rep. 2019;6:253–261. doi: 10.1016/j.toxrep.2019.03.002. - DOI - PMC - PubMed
    1. Lv W., Chen N., Lin Y., Ma H., Ruan Y., Li Z., Li X., Pan X., Tian X. Macrophage migration inhibitory factor promotes breast cancer metastasis via activation of HMGB1/TLR4/NF kappa B axis. Cancer Lett. 2016;375:245–255. doi: 10.1016/j.canlet.2016.02.005. - DOI - PubMed

MeSH terms