. 2021 Mar 31;9(4):727.
doi: 10.3390/microorganisms9040727.

Changes in Gut Microbiota after a Four-Week Intervention with Vegan vs. Meat-Rich Diets in Healthy Participants: A Randomized Controlled Trial

Affiliations

Changes in Gut Microbiota after a Four-Week Intervention with Vegan vs. Meat-Rich Diets in Healthy Participants: A Randomized Controlled Trial

Eva Kohnert et al. Microorganisms. .

Abstract

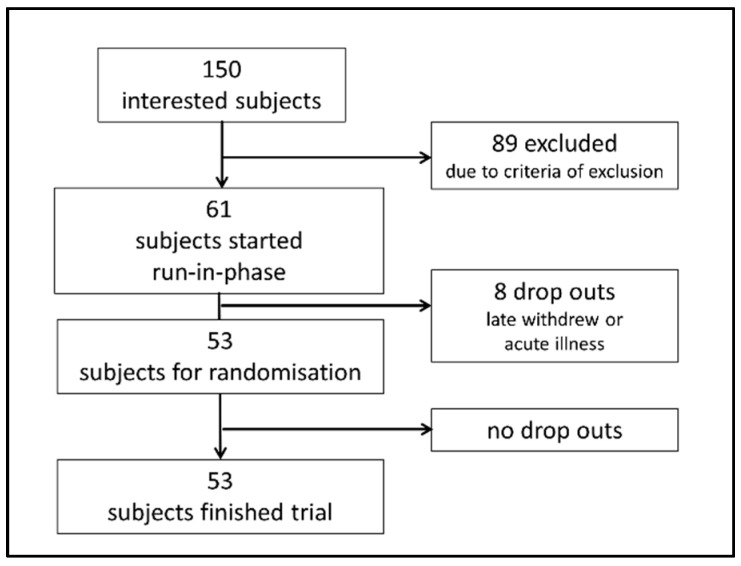
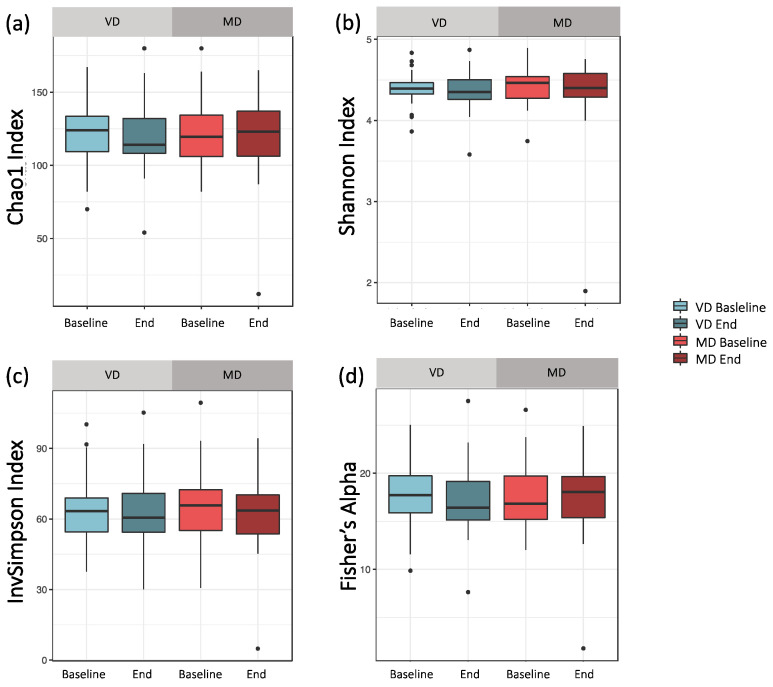
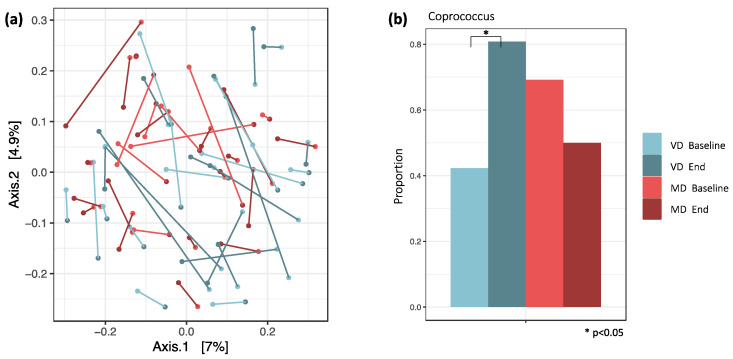
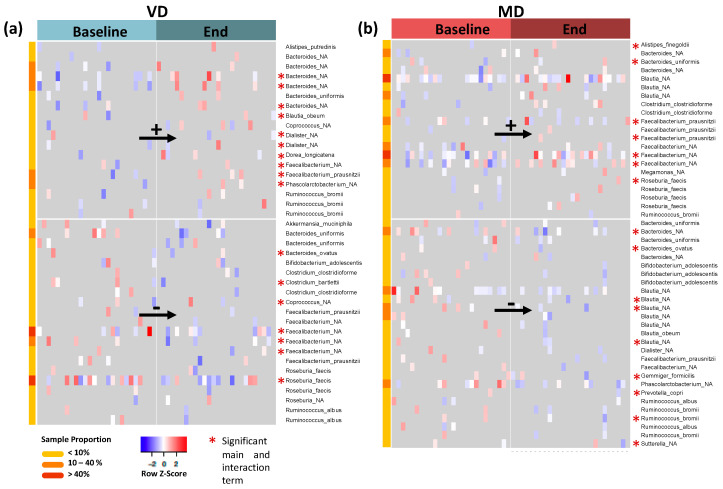
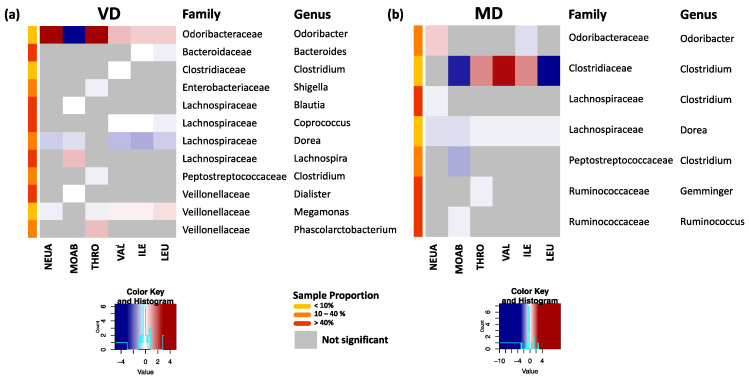
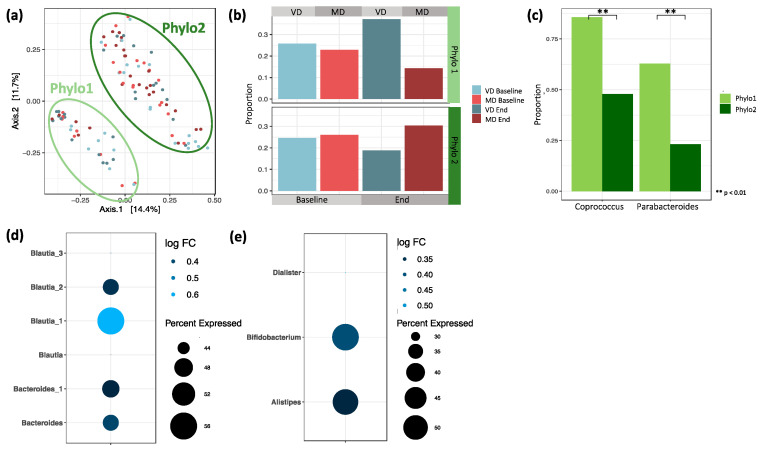
An essential role of the gut microbiota in health and disease is strongly suggested by recent research. The composition of the gut microbiota is modified by multiple internal and external factors, such as diet. A vegan diet is known to show beneficial health effects, yet the role of the gut microbiota is unclear. Within a 4-week, monocentric, randomized, controlled trial with a parallel group design (vegan (VD) vs. meat-rich (MD)) with 53 healthy, omnivore, normal-weight participants (62% female, mean 31 years of age), fecal samples were collected at the beginning and at the end of the trial and were analyzed using 16S rRNA gene amplicon sequencing (Clinical Trial register: DRKS00011963). Alpha diversity as well as beta diversity did not differ significantly between MD and VD. Plotting of baseline and end samples emphasized a highly intra-individual microbial composition. Overall, the gut microbiota was not remarkably altered between VD and MD after the trial. Coprococcus was found to be increased in VD while being decreased in MD. Roseburia and Faecalibacterium were increased in MD while being decreased in VD. Importantly, changes in genera Coprococcus, Roseburia and Faecalibacterium should be subjected to intense investigation as markers for physical and mental health.

Keywords: Coprococcus; Lachnospiraceae; diversity; gut microbiome; nutrition; plant-based diet.


Conflict of interest statement

The authors declare that there is no conflict of interest.

Figures

Figure 1
Figure 1
Flowchart visualizing recruitment of participants. Of 150 interested subjects, 61 were eligible for study inclusion and started a one-week run-in phase with a balanced mixed (omnivorous) diet according to the recommendations of the German Nutrition Association. Eight of these participants suffered from acute illness or withdrew from participation during the run-in phase and were not randomized. Fifty-three participants were randomized to VD or MD and started the trial. All randomized participants finished the trial as per protocol.
Figure 2
Figure 2
Comparing alpha diversity for VD and MD at baseline and end of intervention. (a) Chao1: Bacterial composition of samples based on the number of observed taxa. For both diets, the Chao1 index did not change after the trial (pVD = 0.770, pMD = 0.629). (b) Shannon index: By abundance weighted bacterial composition of samples, reflecting both richness and bacterial evenness within a sample. For both diets, the Shannon index did not change after the trial (pVD = 0.921, pMD = 1.000). (c) Inverse Simpson index: Species richness based on relative abundance. For both diets, the Inverse Simpson index did not change after the trial (pVD = 0.921, pMD = 0.861). (d) Fisher’s index: quantifying the relationship between number and abundance of species. For both diets, the Fisher’s index did not change after the trial (pVD = 0.822, pMD = 0.600).
Figure 3
Figure 3
(a) PCoA plot with Bray–Curtis distances. Similarity of samples based on the weighted abundance of shared taxa. The connections between baseline and end samples indicate that both samples from one individual are very similar. (b) For VD and MD, the proportions of samples in which Coprococcus was detected are plotted. It was the only genus with a significant change in proportions between baseline and end samples in VD. Here, the proportion increased from 42% to 81% (padj = 0.047), while in MD, it decreased from 69% to 50% (padj = 0.672).
Figure 4
Figure 4
(a) Log-transformed and standardized abundances for all ASVs with significant main effects in VD; “_NA” describes unspecified species. Upregulated ASVs are shown in the top panel while downregulated ASVs are displayed in the bottom panel. The asterisk marks all ASVs which also have a significant interaction term, i.e., ASVs with a significantly different change in VD compared to their respective change in MD. (b) Corresponding plot for MD.
Figure 5
Figure 5
(a) Significant associations of clinical markers for neutrophils (NEUA), monocytes (MOAB), thrombocytes (THRO), and branched-chain amino acids valin (VAL), isoleucine (ILE), and leucine (LEU) with bacterial changes at genus level for VD. Here, the standardized estimates are plotted. Strongest associations with changes in the rare genus Odoribacter were observed. Highly abundant genera such as Coporoccus, Dorea, and Megamonas showed correlations with all branched-chain amino acids. (b) Corresponding plot for MD. All markers were associated with changes in Dorea, while the strongest associations occurred with the rare genus Clostridiaceae–Clostridium.
Figure 6
Figure 6
(a) PCoA plot based on pairwise unweighted UniFrac distances between samples. Similarity based on the length of shared phylogenetic branches between samples. (b) Proportion of baseline and end samples split by diet in Phylo1 and Phylo2. Phylo1 is enriched by end samples of VD and Phylo2 by MD (Chi-squared test, p = 0.130). (c) Logistic regression between Phylo1 and Phylo2 revealed two genera with significantly different proportions. Coprococcus differed significantly between Phylo 1 (86%) and Phylo 2 (48%, p = 0.006). Parabacteroides differed significantly between Phylo 1 (63%) and Phylo 2 (23%, p = 0.003). (d) ASVs detected in at least 40% of all samples that are differentially abundant between Phylo2 compared to Phylo1. (e) Genera differentially abundant between Phylo2 compared to Phylo1 after agglomerating ASVs at genus level.

References

    1. Johnson A.J., Zheng J.J., Kang J.W., Saboe A., Knights D., Zivkovic A.M. A Guide to Diet-Microbiome Study Design. Front. Nutr. 2020;7:1–16. doi: 10.3389/fnut.2020.00079. - DOI - PMC - PubMed
    1. Zmora N., Suez J., Elinav E. You are what you eat: Diet, health and the gut microbiota. Nat. Rev. Gastroenterol. Hepatol. 2019;16:35–56. doi: 10.1038/s41575-018-0061-2. - DOI - PubMed
    1. Lynch S.V., Pedersen O. The Human Intestinal Microbiome in Health and Disease. N. Engl. J. Med. 2016;375:2369–2379. doi: 10.1056/NEJMra1600266. - DOI - PubMed
    1. Ghaisas S., Maher J., Kanthasamy A. Gut microbiome in health and disease: Linking the microbiome–gut–brain axis and environmental factors in the pathogenesis of systemic and neurodegenerative diseases. Pharmacol. Ther. 2016;158:52–62. doi: 10.1016/j.pharmthera.2015.11.012. - DOI - PMC - PubMed
    1. Wang Z., Zhao Y. Gut microbiota derived metabolites in cardiovascular health and disease. Protein Cell. 2018;9:416–431. doi: 10.1007/s13238-018-0549-0. - DOI - PMC - PubMed

LinkOut - more resources