. 2021 Mar 5;13(5):1110.
doi: 10.3390/cancers13051110.

ARMCX3 Mediates Susceptibility to Hepatic Tumorigenesis Promoted by Dietary Lipotoxicity

Affiliations

ARMCX3 Mediates Susceptibility to Hepatic Tumorigenesis Promoted by Dietary Lipotoxicity

Serena Mirra et al. Cancers (Basel). .

Abstract

ARMCX3 is encoded by a member of the Armcx gene family and is known to be involved in nervous system development and function. We found that ARMCX3 is markedly upregulated in mouse liver in response to high lipid availability, and that hepatic ARMCX3 is upregulated in patients with NAFLD and hepatocellular carcinoma (HCC). Mice were subjected to ARMCX3 invalidation (inducible ARMCX3 knockout) and then exposed to a high-fat diet and diethylnitrosamine-induced hepatocarcinogenesis. The effects of experimental ARMCX3 knockdown or overexpression in HCC cell lines were also analyzed. ARMCX3 invalidation protected mice against high-fat-diet-induced NAFLD and chemically induced hepatocarcinogenesis. ARMCX3 invalidation promoted apoptotic cell death and macrophage infiltration in livers of diethylnitrosamine-treated mice maintained on a high-fat diet. ARMCX3 downregulation reduced the viability, clonality and migration of HCC cell lines, whereas ARMCX3 overexpression caused the reciprocal effects. SOX9 was found to mediate the effects of ARMCX3 in hepatic cells, with the SOX9 interaction required for the effects of ARMCX3 on hepatic cell proliferation. In conclusion, ARMCX3 is identified as a novel molecular actor in liver physiopathology and carcinogenesis. ARMCX3 downregulation appears to protect against hepatocarcinogenesis, especially under conditions of high dietary lipid-mediated hepatic insult.

Keywords: Alex3; HCC; NAFLD; SOX9; lipotoxicity; obesity.


Conflict of interest statement

The authors declare no conflict of interest.

Figures

Figure 1
Figure 1
ARMCX3 deletion reduces the susceptibility of mice to high-fat diet (HFD)-induced obesity and metabolic alterations. (A) Armcx3 mRNA levels in livers of mice exposed to regular feeding conditions (Control), overnight fasting (Fast), high-fat diet (HFD) or 24 h after intraperitoneal injection with 2 mg/kg tunicamycin (Tun) (left). Immunoblot of ARMCX3 protein levels and loading control (Ponceau staining) in livers from mice fed HFD or treated with tunicamycin for 24 h (right) (For uncropped immunoblots here and thereafter, see File S1). (B) ARMCX3 mRNA levels in liver from healthy individuals (control, n = 19) and NASH patients (n = 24). (C) Schematic representation of the study design: 6-week-old fArmcx3/Cre- (Control) and ARMCX3-KO mice (tamoxifen-induced Cre activity) (KO) were fed low-fat diet (LFD) or HFD for 16 weeks, (left). Body weight curves (left, central), body weight gain (right, central) and dietary energy intake (right). (D) Glycemia (left), insulinemia (middle) and HOMA-IR index (right). (E) Glucose tolerance curves. (F) Representative microscopic pictures of H&E-stained livers (left), and quantification of the percentage of total area occupied by fat (right). Magnification: 10×. (G) Serum ALT levels. Bars indicate means ± SEM; n = 6–8 mice per group. T-student, Mann-Whitney or Two-Way ANOVA test with Tukey or Dunnet post hoc corrections were used. * p ≤ 0.05, ** p ≤ 0.01, *** p ≤ 0.001 and **** p ≤ 0.0001 for comparisons between diets or treatments, and # p ≤ 0.05, ### p ≤ 0.001 for comparisons between genotypes.
Figure 2
Figure 2
ARMCX3 deletion decreases diethylnitrosamine (DEN)-induced tumorigenesis and steatohepatitis in mice exposed to HFD. Data were obtained from 7-month-old fArmcx3/Cre- (Control) or ARMCX3-KO mice (KO) treated with DEN and maintained on LFD or HFD. (A) Schematic representation of the study design: 15-day-old fArmcx3/Cre- (Control) and ARMCX3-KO mice were injected with 25 mg/kg DEN and, beginning at week 6, fed LFD or HFD for 24 weeks. (B) Body weight curves (left) and body weight gain (right). (C) Representative pictures of livers (top) and quantifications of tumor number, size and maximal tumor size (bottom). Representative images and lipid accumulation quantification in liver sections stained with hematoxylin-eosin (D) and Oil-Red O (E). Scale bar: 100 µm. (F) Serum ALT levels. Bars show means ± SEM; n = 9–13 mice per group. Two-Way ANOVA test with Tukey post hoc correction was used. * p ≤ 0.05, ** p ≤ 0.01, *** p ≤ 0.001 and **** p ≤ 0.0001 for comparisons between diets or treatments.
Figure 3
Figure 3
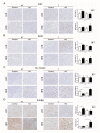
ARMCX3 deletion increases apoptosis and macrophage infiltration in hepatic tumors from HFD-fed mice. Data correspond to liver sections from 7-month-old fA3/Cre- (Control) or ARMCX3-KO mice treated with DEN and maintained on LFD or HFD. Representative liver sections from non-tumor (NT) and tumor (T) sections (left) and quantifications (right) of immunostaining for Ki67 (A), BrdU (B), cleaved caspase-3 (C) and F4/80 (D). Data are means ± SEM of 2–8 mice. Two-Way ANOVA test with Tukey post hoc correction was used. * p ≤ 0.05 and ** p ≤ 0.01. Magnification: 13×.
Figure 4
Figure 4
ARMCX3 deletion affects ERK signaling in hepatic tumors from HFD-fed mice. (A) Representative staining of β-catenin in liver sections from Control or ARMCX3-KO mice maintained on HFD. Sections include both non-tumor (NT) and tumor (T) regions and magnifications are shown. Scale bars: 100 µm and 50 µm (magnified). (B) Immunoblot analysis of the phosphorylation of ERK and p38 (representing pathway activation) in control and ARMCX3-KO mice exposed to HFD. Shown are representative immunoblot images (left) and quantification of phosphorylated/total ratios for ERK and p38 (right). Bars indicate means ± SEM; n = 2–4 mice per group. Two-Way ANOVA test with Tukey post hoc correction was used. * p ≤ 0.05 for comparisons between Control and KO samples.
Figure 4
Figure 4
ARMCX3 deletion affects ERK signaling in hepatic tumors from HFD-fed mice. (A) Representative staining of β-catenin in liver sections from Control or ARMCX3-KO mice maintained on HFD. Sections include both non-tumor (NT) and tumor (T) regions and magnifications are shown. Scale bars: 100 µm and 50 µm (magnified). (B) Immunoblot analysis of the phosphorylation of ERK and p38 (representing pathway activation) in control and ARMCX3-KO mice exposed to HFD. Shown are representative immunoblot images (left) and quantification of phosphorylated/total ratios for ERK and p38 (right). Bars indicate means ± SEM; n = 2–4 mice per group. Two-Way ANOVA test with Tukey post hoc correction was used. * p ≤ 0.05 for comparisons between Control and KO samples.
Figure 5
Figure 5
ARMCX3 deletion reduces the viability, clonality and invasivity of HCC cells in vitro. (A) ARMCX3 mRNA levels in Hep3B and SNU423 HCC cells 24 h and 48 h after transfection with ARMCX3 siRNA versus negative control siRNA (top dotted line), **** p ≤ 0.0001. (B) Colony-forming assays performed with Hep3B and SNU423 cells transfected with negative control siRNA (Control) or ARMCX3 siRNA. (C) Representative images of wound-healing assay results obtained using control and ARMCX3-KD Hep3B cells. Magnification: 10× (D) Percentage viability of control and ARMCX3-KD Hep3B and SNU423 cells at 24 h, 48 h and 72 h after transfection. Bars show the means ± SEM of three independent cell culture points. Two-Way ANOVA test with Dunnett post hoc correction was used. * p ≤ 0.05, ** p ≤ 0.01, *** p ≤ 0.001 and **** p ≤ 0.0001.
Figure 6
Figure 6
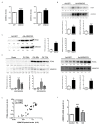
ARMCX3 expression correlates with the proliferative capacity in hepatocytes. (A) MTT and colony-forming assays in SNU423 cells overexpressing ARMCX3 at 48 h post-transduction. (B) PCNA protein levels in the cells described in (A), presented as representative immunoblots (top) and quantification (bottom) of PCNA and ARMCX3 levels. (C) PCNA protein levels in primary hepatocytes overexpressing ARMCX3 at 48 h post-transduction, presented as representative immunoblots (left) and quantification (right) of PCNA and ARMCX3 levels. (D) PCNA and ARMCX3 protein levels in livers of mice subjected to partial hepatectomy at 24 h, 48 h or 72 h post-surgery, and in livers of mice treated with CCl4 for 48 h; representative immunoblots (top) and quantifications (bottom) are presented. (E) Pearson’s correlation between ARMCX3 and PCNA protein levels in hepatocytes (n = 30). (F) ARMCX3 mRNA levels in HepG2 cells treated with palmitic acid (0.3 mM) or oleic acid (0.6 mM) for 24 h. Ponceau staining, which was used as a loading control in the immunoblots, is shown in Figure S5. T-student or Mann-Whitney test with Dunnett post hoc corrections were used. * p ≤ 0.05, ** p ≤ 0.01, *** p ≤ 0.001 and **** p ≤ 0.0001.
Figure 7
Figure 7
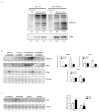
ARMCX3-induced hepatocyte proliferation involves SOX9. (A) Immunodetection of ARMCX3 and SOX9 in SOX9 pull-down samples from HepG2 cells transduced with Ad-GFP or Ad-ARMCX3 at 48 h post-transduction. (B) ARMCX3, SOX9 and PCNA levels in HepG2 cells at 48 h after cells were transduced with Ad-GFP or Ad-ARMCX3 and transfected with scrambled siRNA (Control) or SOX9 siRNA. Representative immunoblots (top) and quantification (bottom) are shown. Bars indicate means ± SEM of three independent experiments. Two-Way ANOVA test with Tukey post hoc correction was used. * p ≤ 0.05 for comparisons between siControl and siSOX9, and ## p ≤ 0.01 for comparisons between GFP and ARMCX3. (C) SOX9 levels in 7-month-old fArmcx3/Cre- (Control) or ARMCX3-KO mice (KO) treated with DEN and maintained on LFD or HFD for 24 weeks. Bars indicate means ± SEM; n = 9–13 mice per group. Two-Way ANOVA test with Tukey post hoc correction was used. ## p ≤ 0.01 for comparisons between genotypes.
Figure 8
Figure 8
Schematic representation of the role of hepatic ARMCX3, in interaction with SOX9, in eliciting proliferative signals and hepatocarcinogenesis in response to lipotoxicity and hepatic damaging signals.

Similar articles

Cited by

References

    1. Lopez-Domenech G., Serrat R., Mirra S., D’Aniello S., Somorjai I., Abad A., Vitureira N., García-Arumí E., Alonso M.T., Rodriguez-Prados M., et al. The Eutherian Armcx genes regulate mitochondrial trafficking in neurons and interact with Miro and Trak2. Nat. Commun. 2012;3:814. doi: 10.1038/ncomms1829. - DOI - PubMed
    1. Serrat R., Lopez-Domenech G., Mirra S., Quevedo M., Garcia-Fernandez J., Burgaya F., Soriano E. The non-canonical Wnt/PKC pathway regulates mitochondrial dynamics through degradation of the arm-like domain-containing protein ARMCX3. PLoS ONE. 2013;8:e67773. doi: 10.1371/journal.pone.0067773. - DOI - PMC - PubMed
    1. Mirra S., Ulloa F., Gutierrez-Vallejo I., Marti E., Soriano E. Function of Armcx3 and Armc10/SVH Genes in the Regulation of Progenitor Proliferation and Neural Differentiation in the Chicken Spinal Cord. Front. Cell. Neurosci. 2016;10:47. doi: 10.3389/fncel.2016.00047. - DOI - PMC - PubMed
    1. Kurochkin I.V., Yonemitsu N., Funahashi S.I., Nomura H. ALEX1, a novel human armadillo repeat protein that is expressed differentially in normal tissues and carcinomas. Biochem. Biophys. Res. Commun. 2001;280:340–347. doi: 10.1006/bbrc.2000.4125. - DOI - PubMed
    1. Rohrbeck A., Borlak J. Cancer genomics identifies regulatory gene networks associated with the transition from dysplasia to advanced lung adenocarcinomas induced by c-Raf-1. PLoS ONE. 2009;4:e7315. doi: 10.1371/journal.pone.0007315. - DOI - PMC - PubMed

LinkOut - more resources