

TNMplot.com: A Web Tool for the Comparison of Gene Expression in Normal, Tumor and Metastatic Tissues
- PMID: 33807717
- PMCID: PMC7961455
- DOI: 10.3390/ijms22052622
TNMplot.com: A Web Tool for the Comparison of Gene Expression in Normal, Tumor and Metastatic Tissues
Abstract
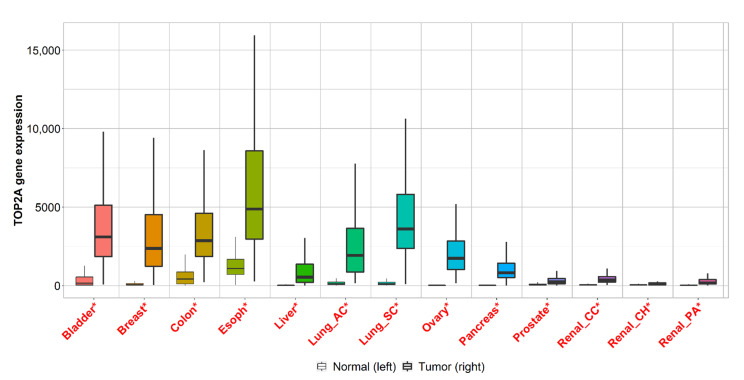
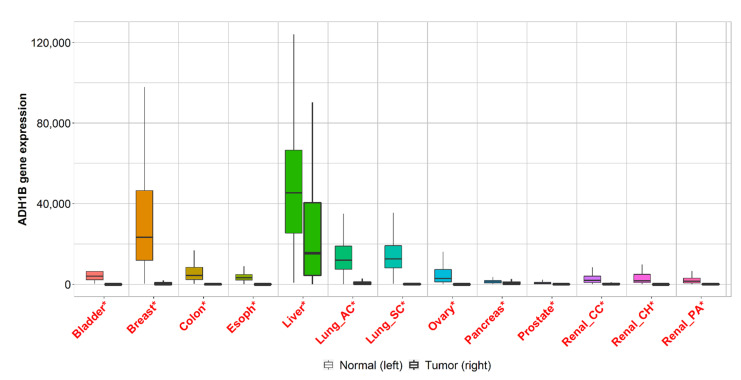
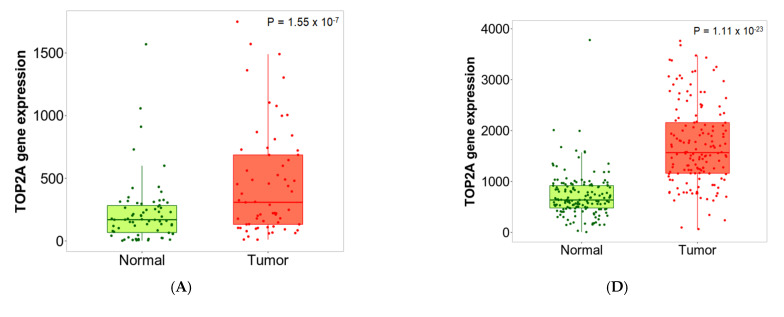
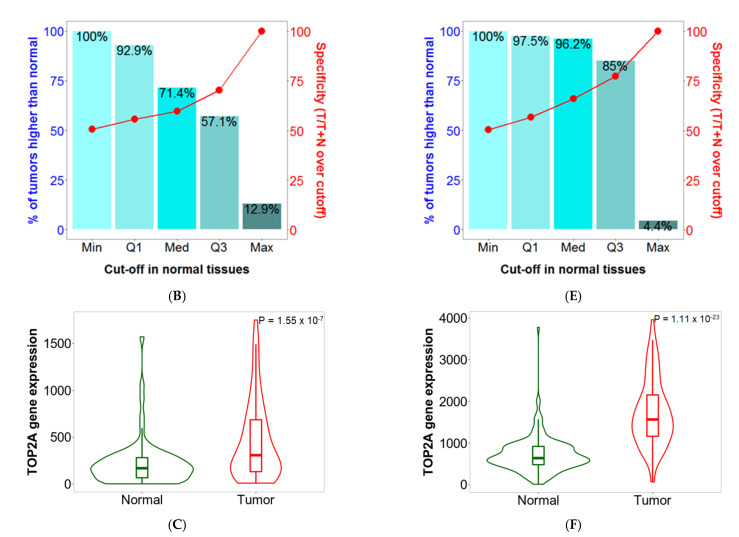
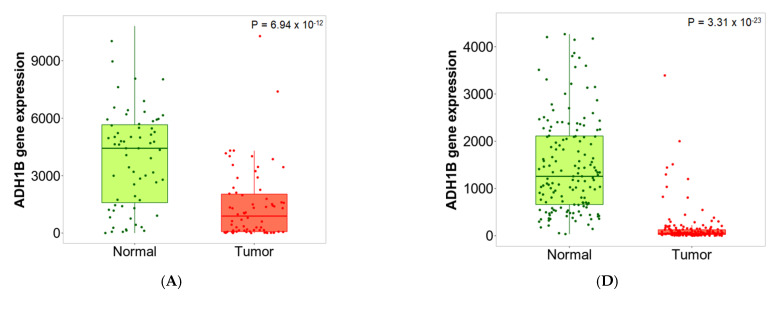
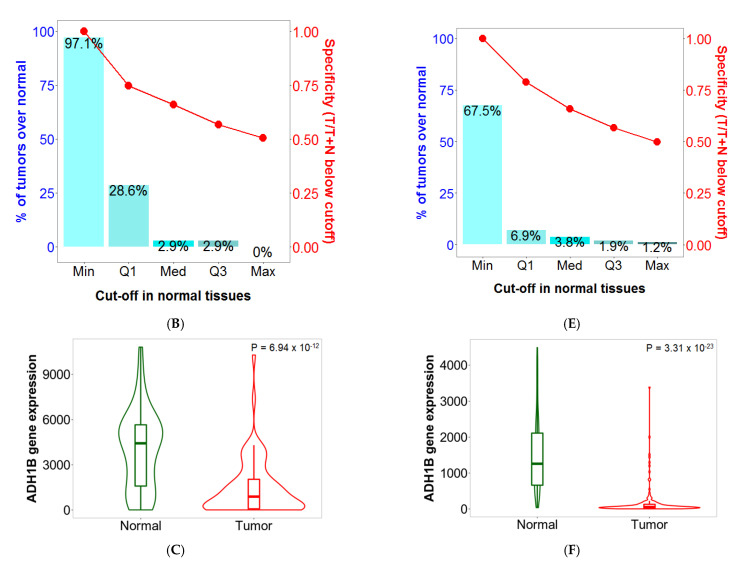
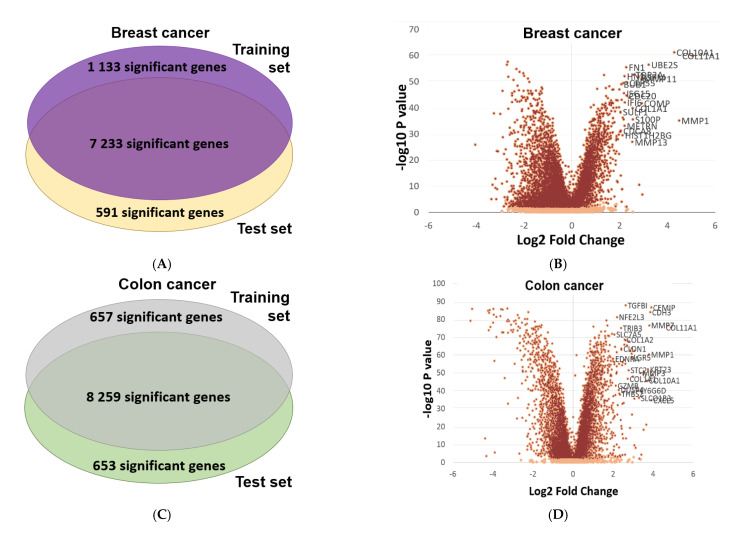
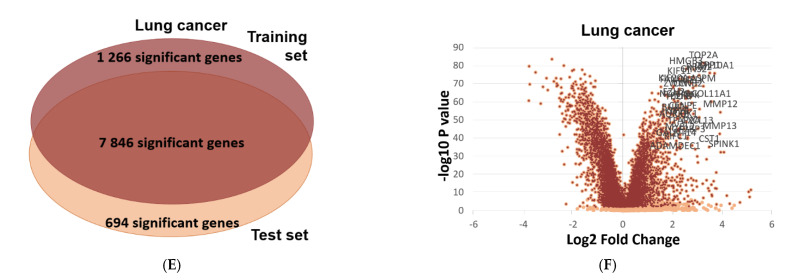
Genes showing higher expression in either tumor or metastatic tissues can help in better understanding tumor formation and can serve as biomarkers of progression or as potential therapy targets. Our goal was to establish an integrated database using available transcriptome-level datasets and to create a web platform which enables the mining of this database by comparing normal, tumor and metastatic data across all genes in real time. We utilized data generated by either gene arrays from the Gene Expression Omnibus of the National Center for Biotechnology Information (NCBI-GEO) or RNA-seq from The Cancer Genome Atlas (TCGA), Therapeutically Applicable Research to Generate Effective Treatments (TARGET), and The Genotype-Tissue Expression (GTEx) repositories. The altered expression within different platforms was analyzed separately. Statistical significance was computed using Mann-Whitney or Kruskal-Wallis tests. False Discovery Rate (FDR) was computed using the Benjamini-Hochberg method. The entire database contains 56,938 samples, including 33,520 samples from 3180 gene chip-based studies (453 metastatic, 29,376 tumorous and 3691 normal samples), 11,010 samples from TCGA (394 metastatic, 9886 tumorous and 730 normal), 1193 samples from TARGET (1 metastatic, 1180 tumorous and 12 normal) and 11,215 normal samples from GTEx. The most consistently upregulated genes across multiple tumor types were TOP2A (FC = 7.8), SPP1 (FC = 7.0) and CENPA (FC = 6.03), and the most consistently downregulated gene was ADH1B (FC = 0.15). Validation of differential expression using equally sized training and test sets confirmed the reliability of the database in breast, colon, and lung cancer at an FDR below 10%. The online analysis platform enables unrestricted mining of the database and is accessible at TNMplot.com.
Keywords: RNA-seq; cancer; differential expression; gene array; transcriptomics.
Conflict of interest statement
The authors declare no conflict of interest.
Figures
Comment in
-
Paraoxonase-2 expression in oral squamous cell carcinoma.Hum Cell. 2023 May;36(3):1211-1213. doi: 10.1007/s13577-023-00875-w. Epub 2023 Feb 11. Hum Cell. 2023. PMID: 36774414 No abstract available.
References
MeSH terms
Grants and funding
- 2018-2.1.17-TET-KR-00001/Higher Education Institutional Excellence Programme of the Ministry for Innovation and Technology Hungary
- 2018-1.3.1-VKE-2018-00032/Higher Education Institutional Excellence Programme of the Ministry for Innovation and Technology Hungary
- 2020-4.1.1.-TKP2020/Higher Education Institutional Excellence Programme of the Ministry for Innovation and Technology Hungary
LinkOut - more resources
Full Text Sources
Other Literature Sources
Medical
Molecular Biology Databases
Research Materials
Miscellaneous
