Review
. 2021 Mar 5;12(3):225.
doi: 10.3390/insects12030225.

Likely Geographic Distributional Shifts among Medically Important Tick Species and Tick-Associated Diseases under Climate Change in North America: A Review

Affiliations
Review

Likely Geographic Distributional Shifts among Medically Important Tick Species and Tick-Associated Diseases under Climate Change in North America: A Review

Abdelghafar Alkishe et al. Insects. .

Abstract

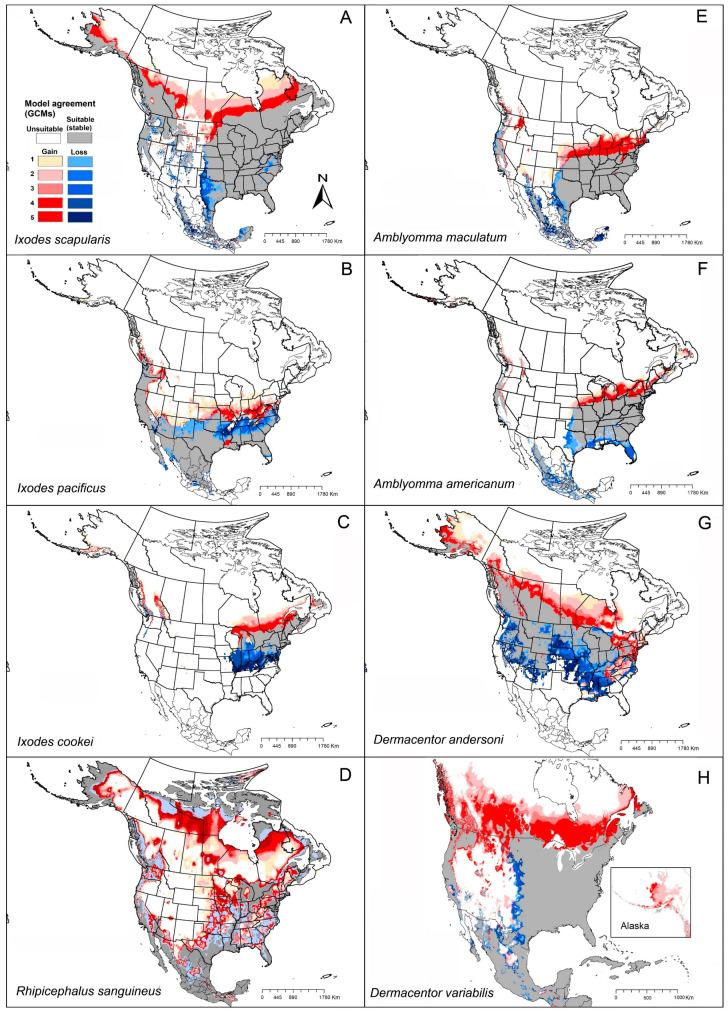
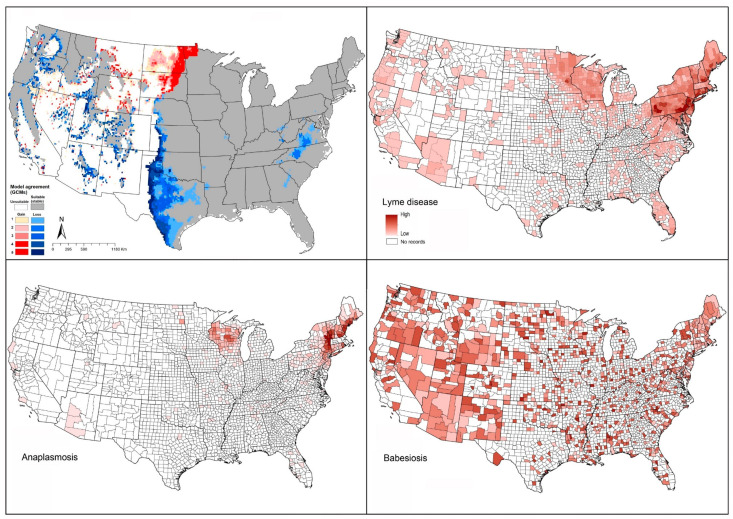
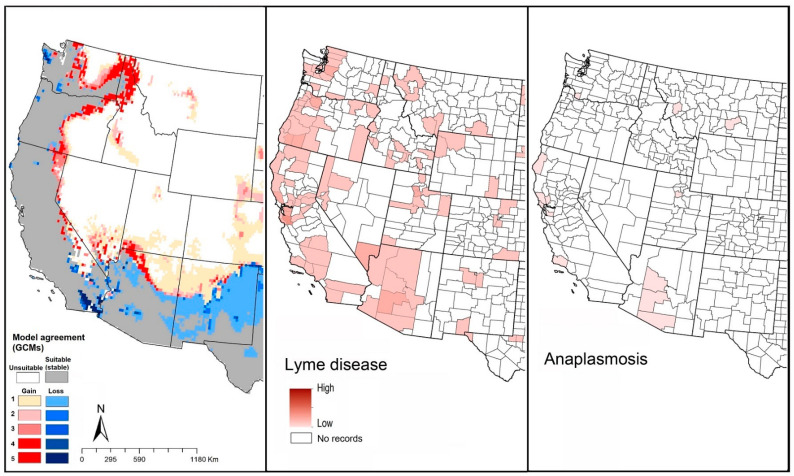
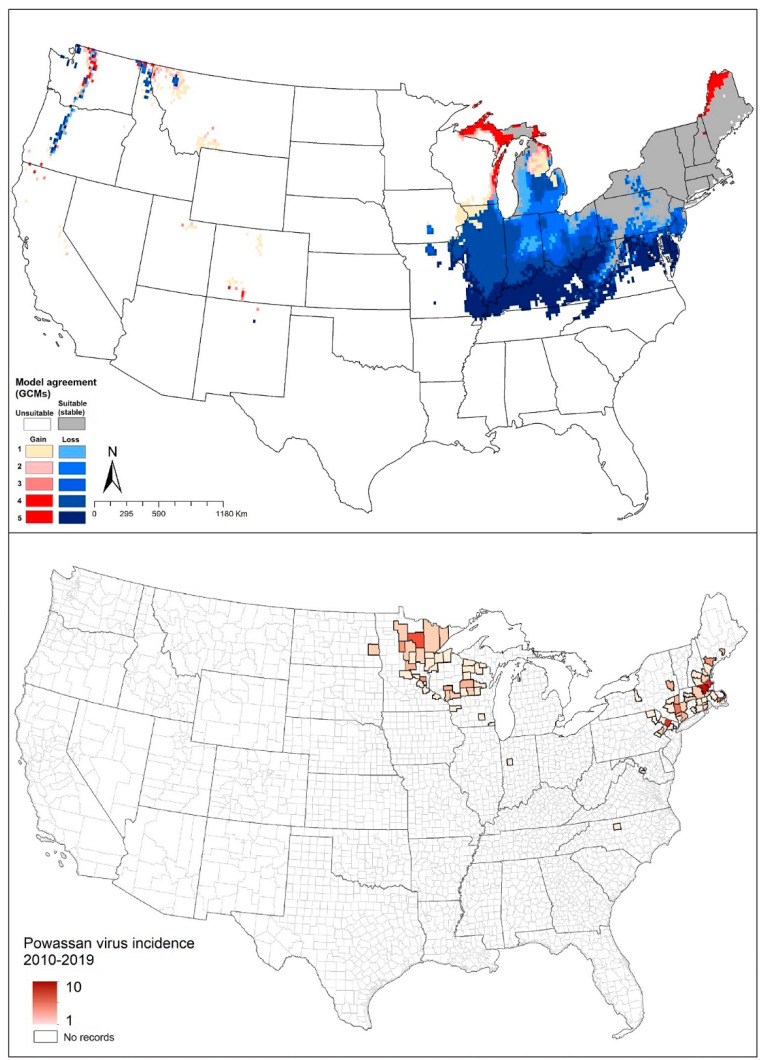
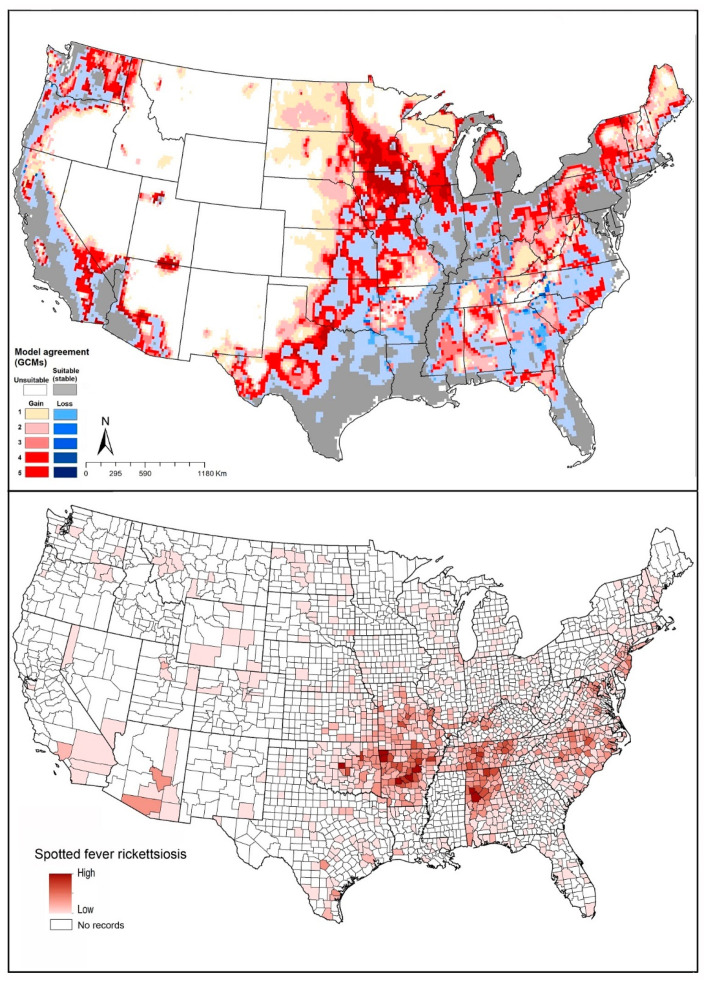
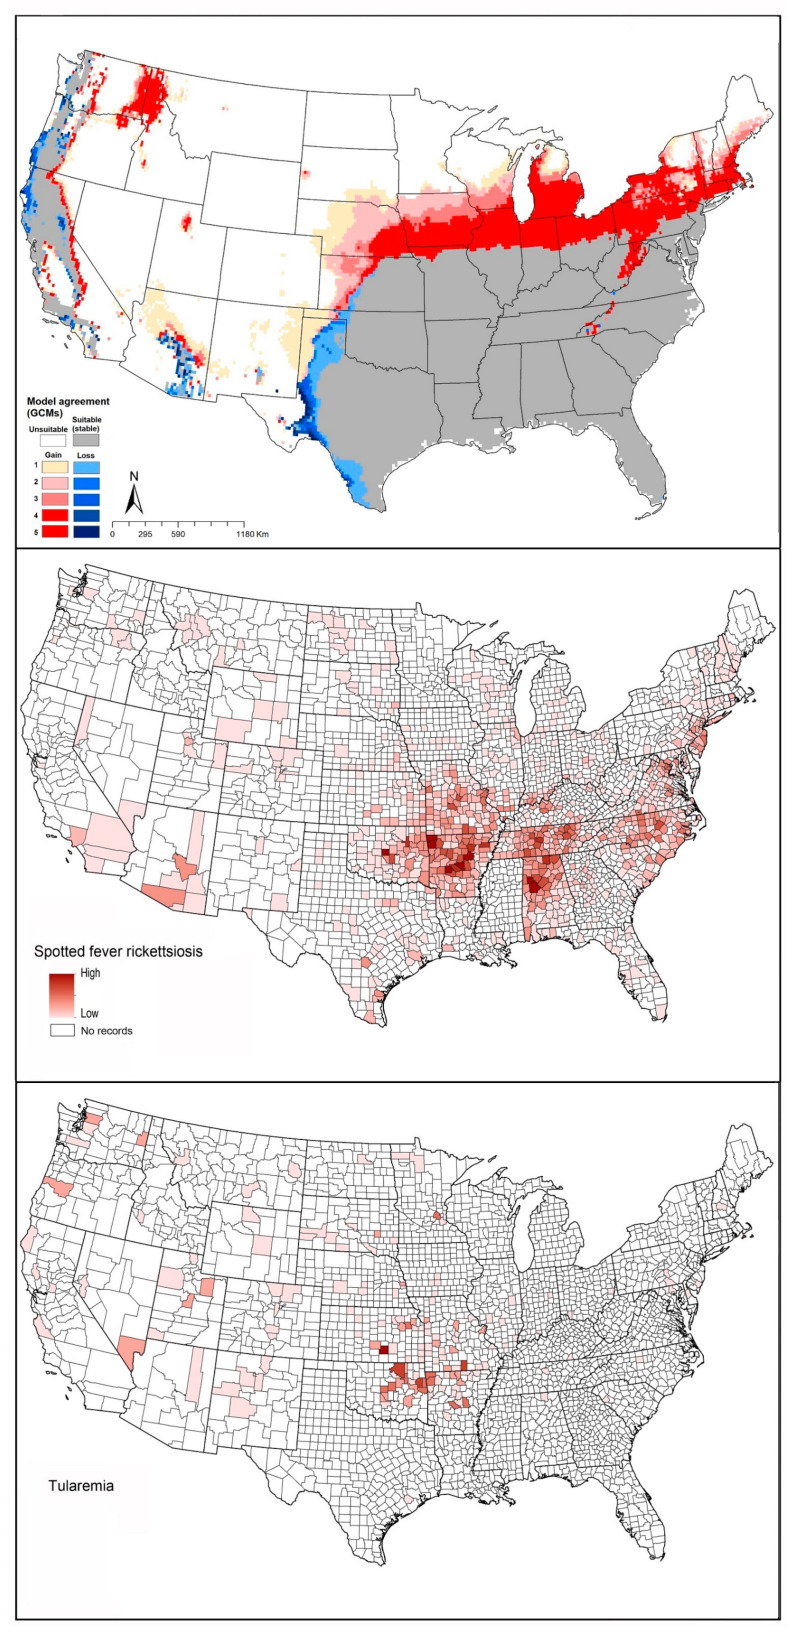
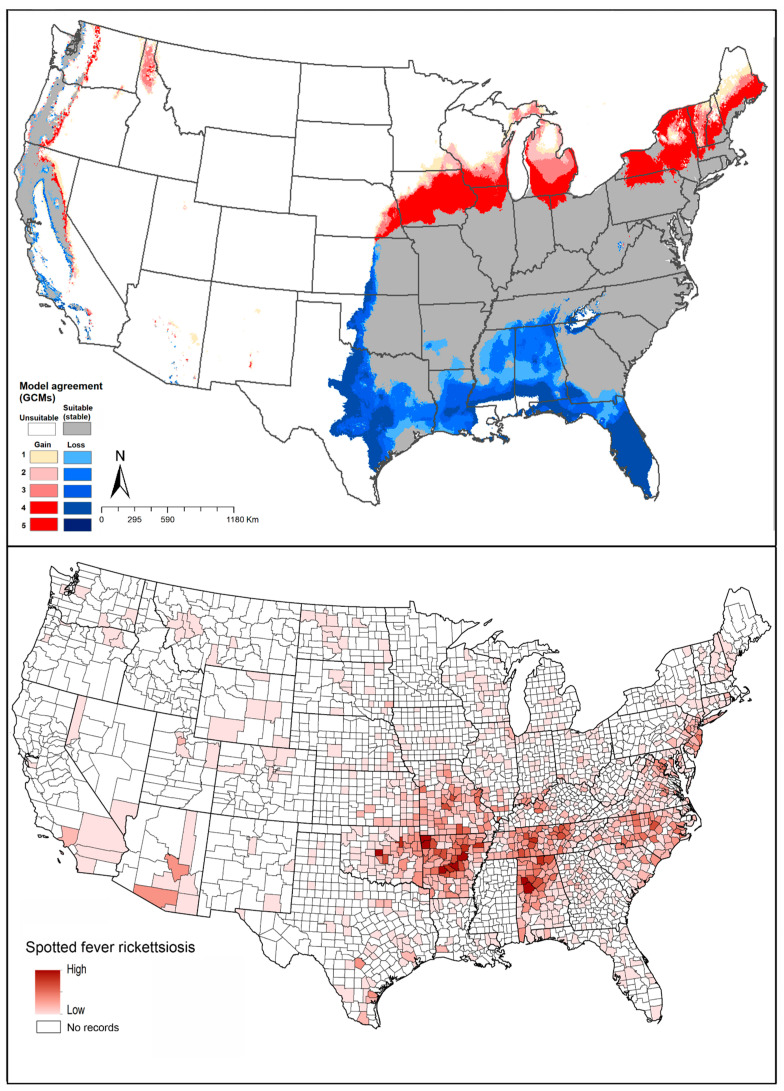
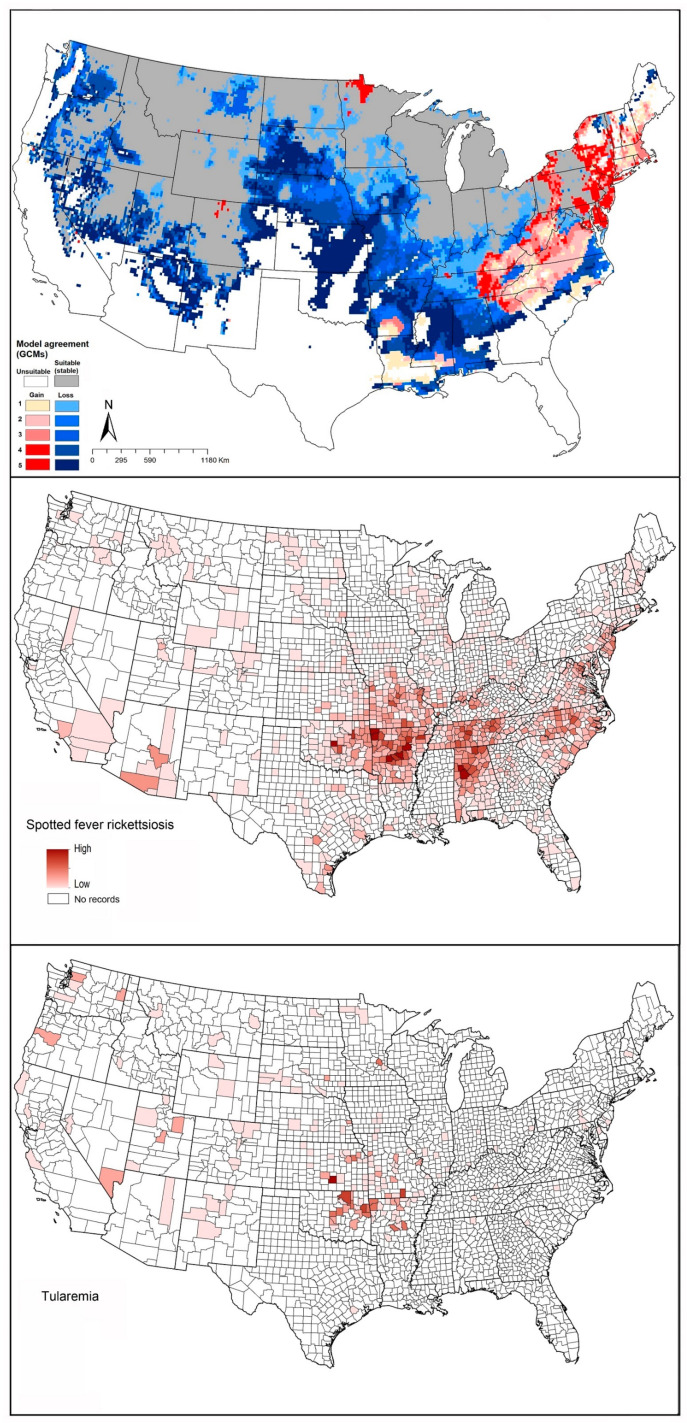
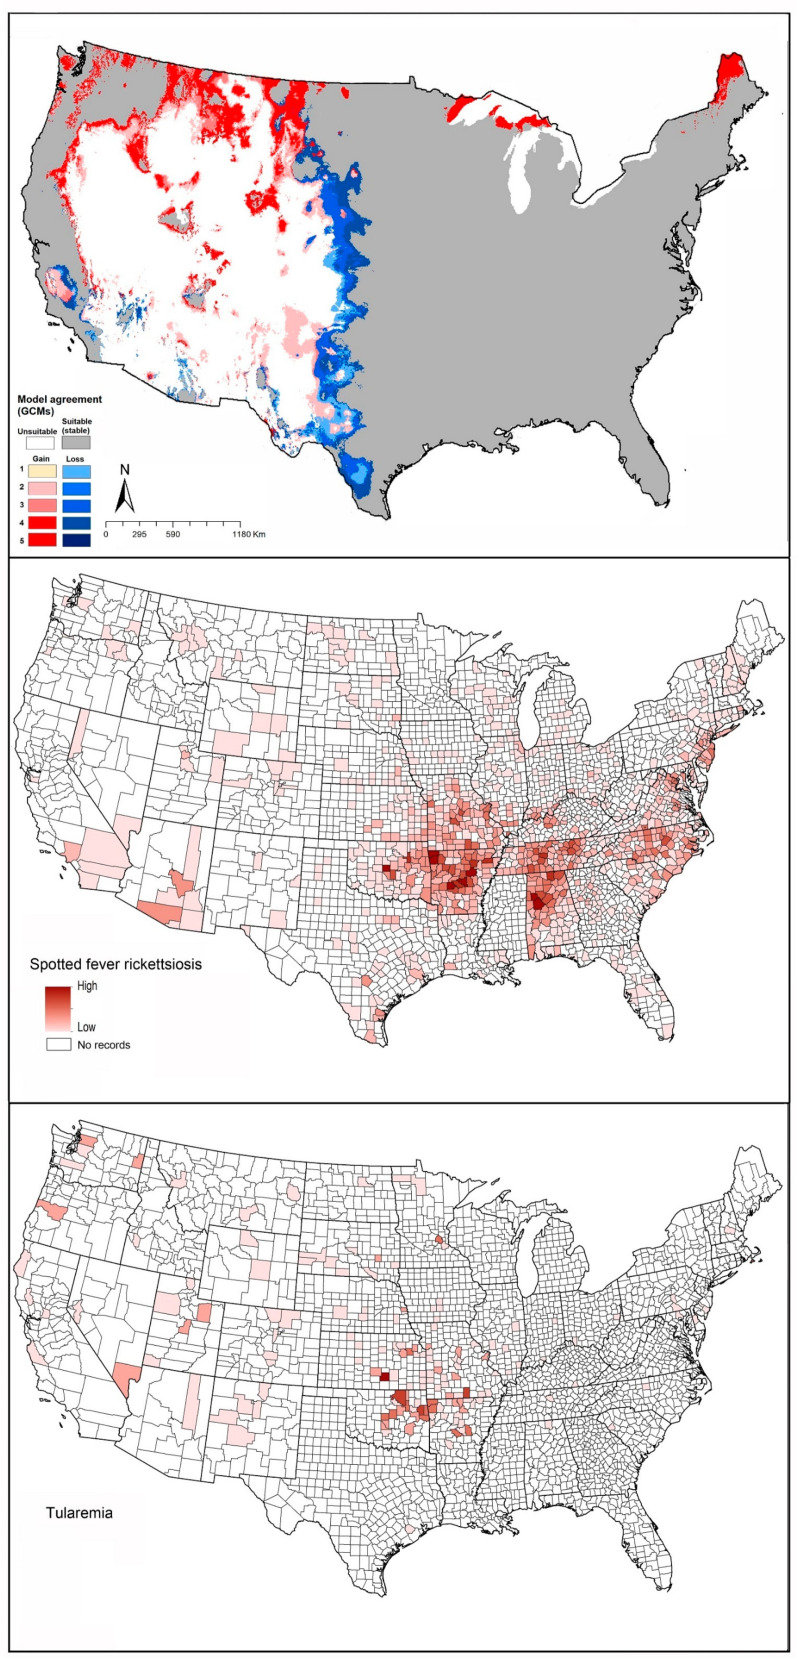
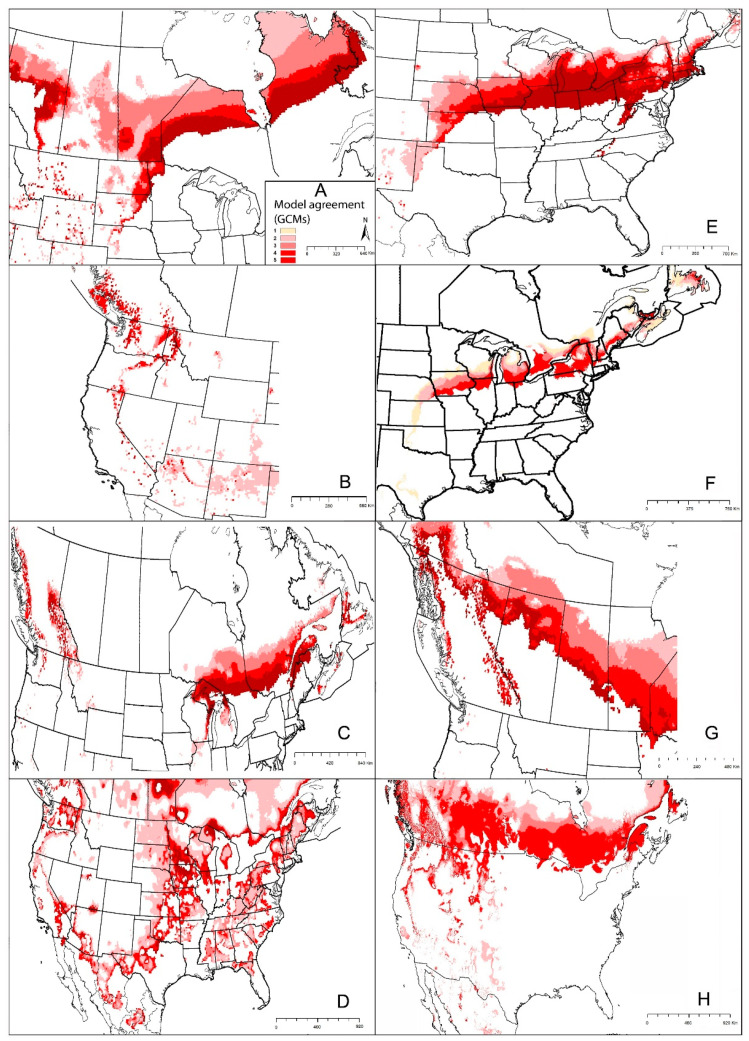
Ticks rank high among arthropod vectors in terms of numbers of infectious agents that they transmit to humans, including Lyme disease, Rocky Mountain spotted fever, Colorado tick fever, human monocytic ehrlichiosis, tularemia, and human granulocytic anaplasmosis. Increasing temperature is suspected to affect tick biting rates and pathogen developmental rates, thereby potentially increasing risk for disease incidence. Tick distributions respond to climate change, but how their geographic ranges will shift in future decades and how those shifts may translate into changes in disease incidence remain unclear. In this study, we have assembled correlative ecological niche models for eight tick species of medical or veterinary importance in North America (Ixodes scapularis, I. pacificus, I. cookei, Dermacentor variabilis, D. andersoni, Amblyomma americanum, A. maculatum, and Rhipicephalus sanguineus), assessing the distributional potential of each under both present and future climatic conditions. Our goal was to assess whether and how species' distributions will likely shift in coming decades in response to climate change. We interpret these patterns in terms of likely implications for tick-associated diseases in North America.

Keywords: Canada; Mexico; United States; current and future scenarios; ecological niche modeling; potential geographic distribution.


Conflict of interest statement

The authors declare that there is no conflict of interest.

Figures

Figure 1
Figure 1
Climate variables for present (white color = no change) and future conditions (National science foundation department of energy, national center for atmospheric research, USA). General circulation model (GCM: CESM1) under representative concentration pathway (RCP 4.5 and RCP 8.5) for the year 2050.
Figure 2
Figure 2
Summary of the potential geographic distributions of eight medically important ticks, both at present and into the future (under RCP4.5). Gray represents stable suitable areas. Red indicates expansion suitable areas under future conditions (dark red = high model agreement, light red = low model agreement). Blue indicates suitable in current time, but not suitable in future (dark blue = high model agreement, light blue = low model agreement).
Figure 3
Figure 3
Geographic distribution of Ixodes scapularis and diseases that it is suspected to transmit in the United States. Dark pink represents high incidence, light pink indicates low incidence. White represents no records.
Figure 4
Figure 4
Geographic distribution of Ixodes pacificus and the diseases that it likely transmits in the United States. Dark pink represents high incidence, light pink indicates low incidence. White represents no records.
Figure 5
Figure 5
Geographic distribution of Ixodes cookei and Powassan encephalitis virus in the United States. Dark pink represents high incidence, light pink indicates low incidence. White represents no records.
Figure 6
Figure 6
Geographic distribution of Rhipicephalus sanguineus and the disease that it likely transmits in the United States. Dark pink represents high incidence, light pink indicates low incidence. White represents no records.
Figure 7
Figure 7
Geographic distribution of Amblyomma maculatum and the diseases that it likely transmits in the United States. Dark pink represents high incidence, light pink indicates low incidence. White represents no records.
Figure 8
Figure 8
Geographic distribution of Amblyomma americanum and the disease that it likely transmits in the United States. Dark pink represents high incidence, light pink indicates low incidence. White represents no records.
Figure 9
Figure 9
Geographic distribution of Dermacentor andersoni and the diseases that it likely transmits in the United States. Dark pink represents high incidence, light pink indicates low incidence. White represents no records.
Figure 10
Figure 10
Geographic distribution of Dermacentor variabilis and the diseases that it likely transmits in the United States. Dark pink represents high incidence, light pink indicates low incidence. White represents no records.
Figure 11
Figure 11
Summary of the potential expansion in geographic distribution of eight medical important ticks using five GCMs (CCCMA-CANESM2, CESM1-BGC, GISS-E2-R, IPSL-CM5A-MR, CCSM4) (under RCP4.5). Dark red indicates high agreement among models GCMs. (A) Ixodes scapularis, (B) I. pacificus, (C) I. cookei, (D) Rhipicephalus sanguineus, (E) Amblyomma maculatum, (F) A. americanum, (G) Dermacentor andersoni, (H) D. variabilis.

Similar articles

Cited by

References

    1. Ogden N.H., Lindsay L.R. Effects of climate and climate change on vectors and vector-borne diseases: Ticks are different. Trends Parasitol. 2016;32:646–656. doi: 10.1016/j.pt.2016.04.015. - DOI - PubMed
    1. Sonenshine D.E., Roe R.M. Biology of Ticks. Volume 2 Oxford University Press; Oxford, UK: 2013.
    1. Bowman A.S., Nuttall P.A. Ticks: Biology, Disease and Control. Cambridge University Press; Cambridge, UK: 2008.
    1. Climate Central 2019 Wrapped Up the Warmest Decade on Record. Climate Central. [(accessed on 15 August 2020)];2020 Available online: https://www.climatecentral.org/gallery/graphics/2019-wrapped-up-the-warm....
    1. Bush E., Lemmen D.S. Canada’s Changing Climate Report. Government of Canada; Ottawa, ON, Canada: 2019.

LinkOut - more resources